


- Bitcoin price extends its gains on Wednesday after rising 5% over the past two days.
- Ethereum is nearing its key resistance level of $2,461; a breakout would suggest a potential rally ahead.
- XRP approaches its 50-day EMA at $2.21; a decisive close above would signal a sharp upward move.
Bitcoin (BTC) price continued to trade in green on Wednesday, having risen 5% over the previous two days. Ethereum (ETH) and Ripple (XRP) followed BTC’s footsteps and rallied, approaching their key resistance levels, where a breakout would suggest further upside moves.
Bitcoin could rally towards its all-time highs
Bitcoin price reached a low of $98,200 on Sunday but recovered sharply by 5% over the next two days, closing above its 50-day Exponential Moving Average at $103,352. At the time of writing on Monday, it continues to trade higher at around $106,500.
If BTC continues its upward trend, it could extend the rally toward its May 22 all-time high at $111,980.
The Relative Strength Index (RSI) on the daily chart reads 54, above its neutral level of 50, indicating bullish momentum. The Moving Average Convergence Divergence (MACD) is hinting at a bullish crossover (the MACD line is close to crossing above the signal line), which, if completed, would give a buy signal.
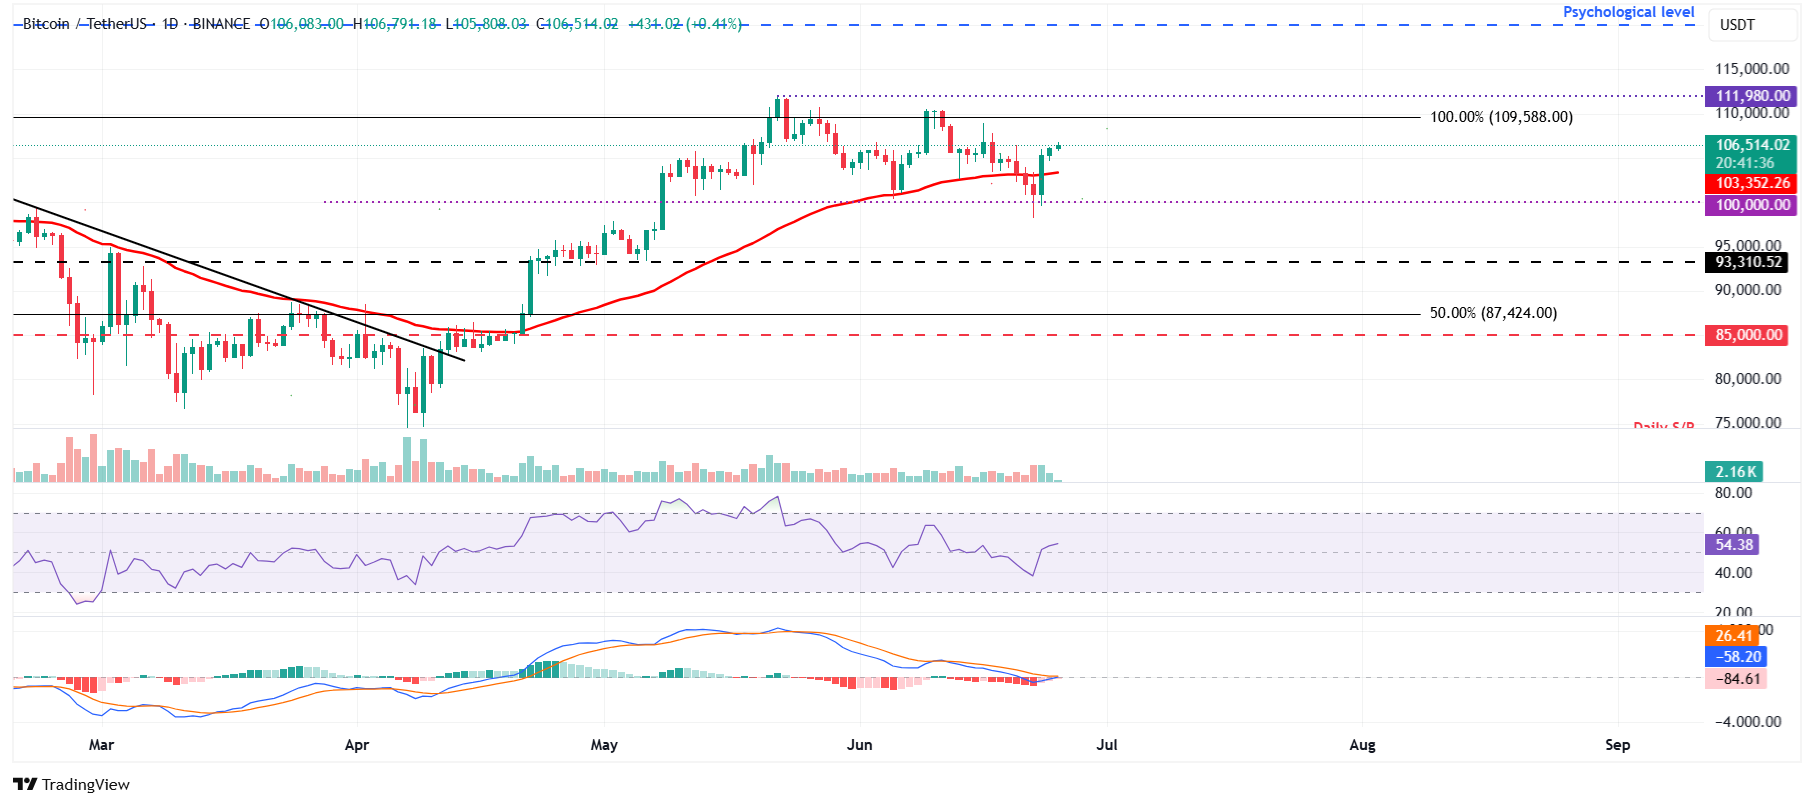
BTC/USDT daily chart
However, if BTC faces a correction and closes below the 50-day EMA at $103,352, it could extend the decline to retest its Sunday low of $98,200.
Ethereum could extend the rally if it closes above key resistance at $2,461
Ethereum price has recovered nearly 10% over the last two days, since Monday, and closed above its 50-day EMA at $2,425. At the time of writing on Wednesday, it is nearing its key resistance at $2,461.
If ETH closes above its resistance at $2,461, it could extend the rally toward its next resistance at $2,724.
The RSI on the daily chart hovers around its neutral level of 50, indicating fading bullish momentum. For the bullish momentum to be sustained, the RSI should continue to move above its neutral level. The MACD is hinting at a bullish crossover (the MACD line is close to crossing above the signal line), which, if completed, would give a buy signal.
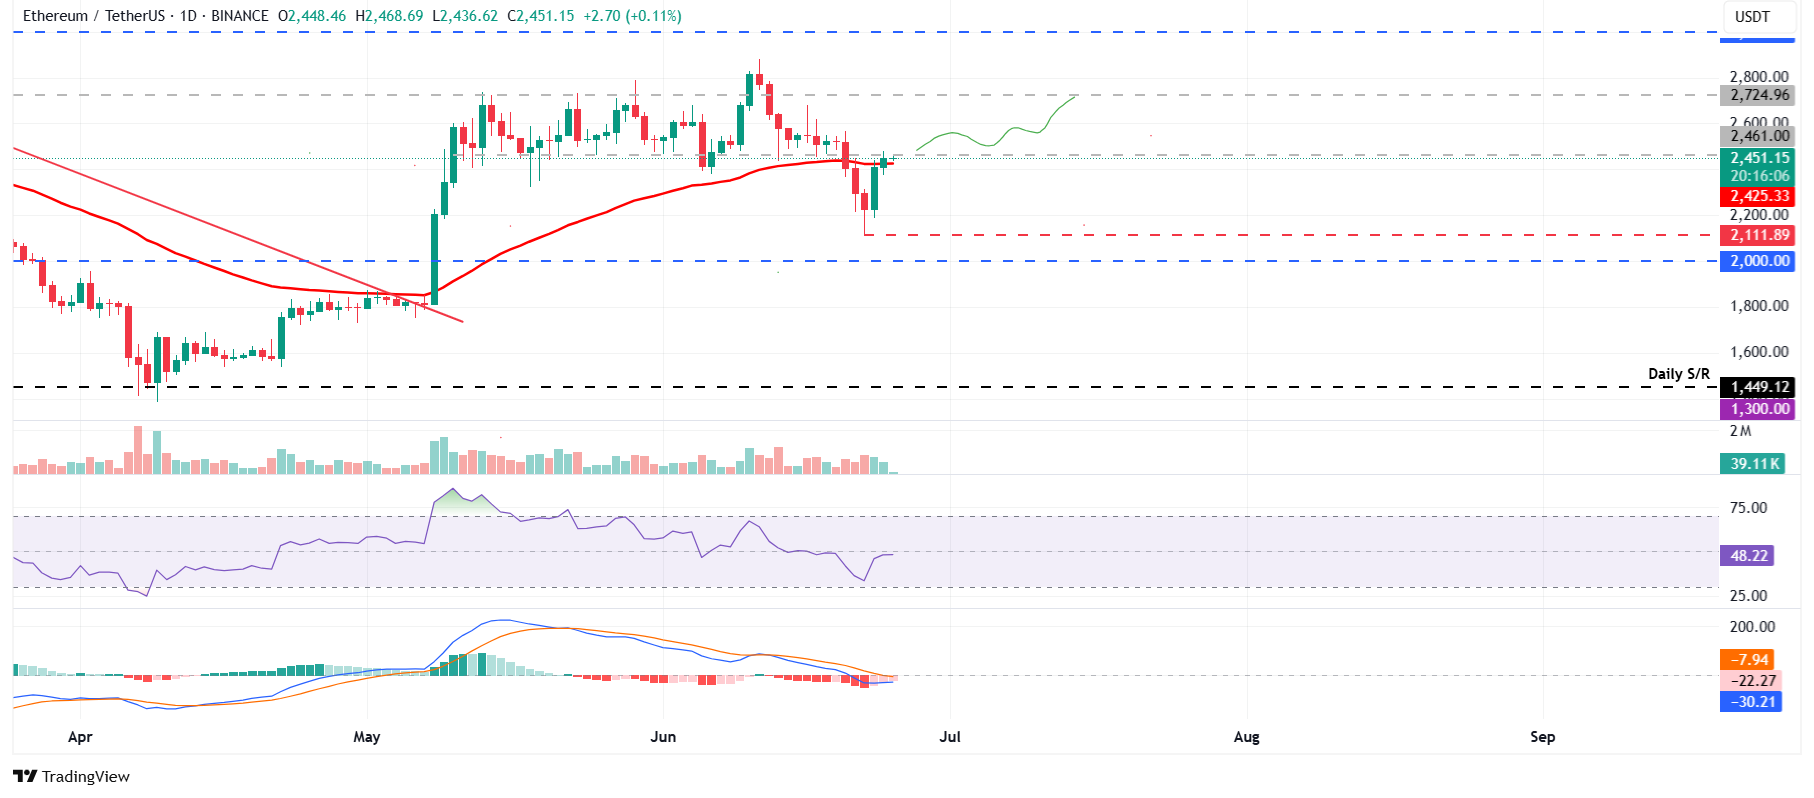
ETH/USDT daily chart
On the other hand, if ETH fails to break above its resistance at $2,461 and faces a correction, it could extend the decline toward its Sunday low of $2,111.
XRP is poised for an upleg if it closes above its 50-day EMA
XRP retested and rebounded after testing its daily support at $1.96 on Monday and rallied 8.55% until the next day. At the time of writing on Wednesday, it is approaching its 50-day EMA at 2.21.
If XRP breaks and closes above its 50-day EMA at $2.21 on a daily basis, it could extend the decline toward its May 23 high of $2.47.
The RSI on the daily chart hovers around its neutral level of 50, indicating fading bullish momentum. For the bullish momentum to be sustained, the RSI should continue to move above its neutral level. The MACD is hinting at a bullish crossover (the MACD line is close to crossing above the signal line), which, if completed, would give a buy signal.
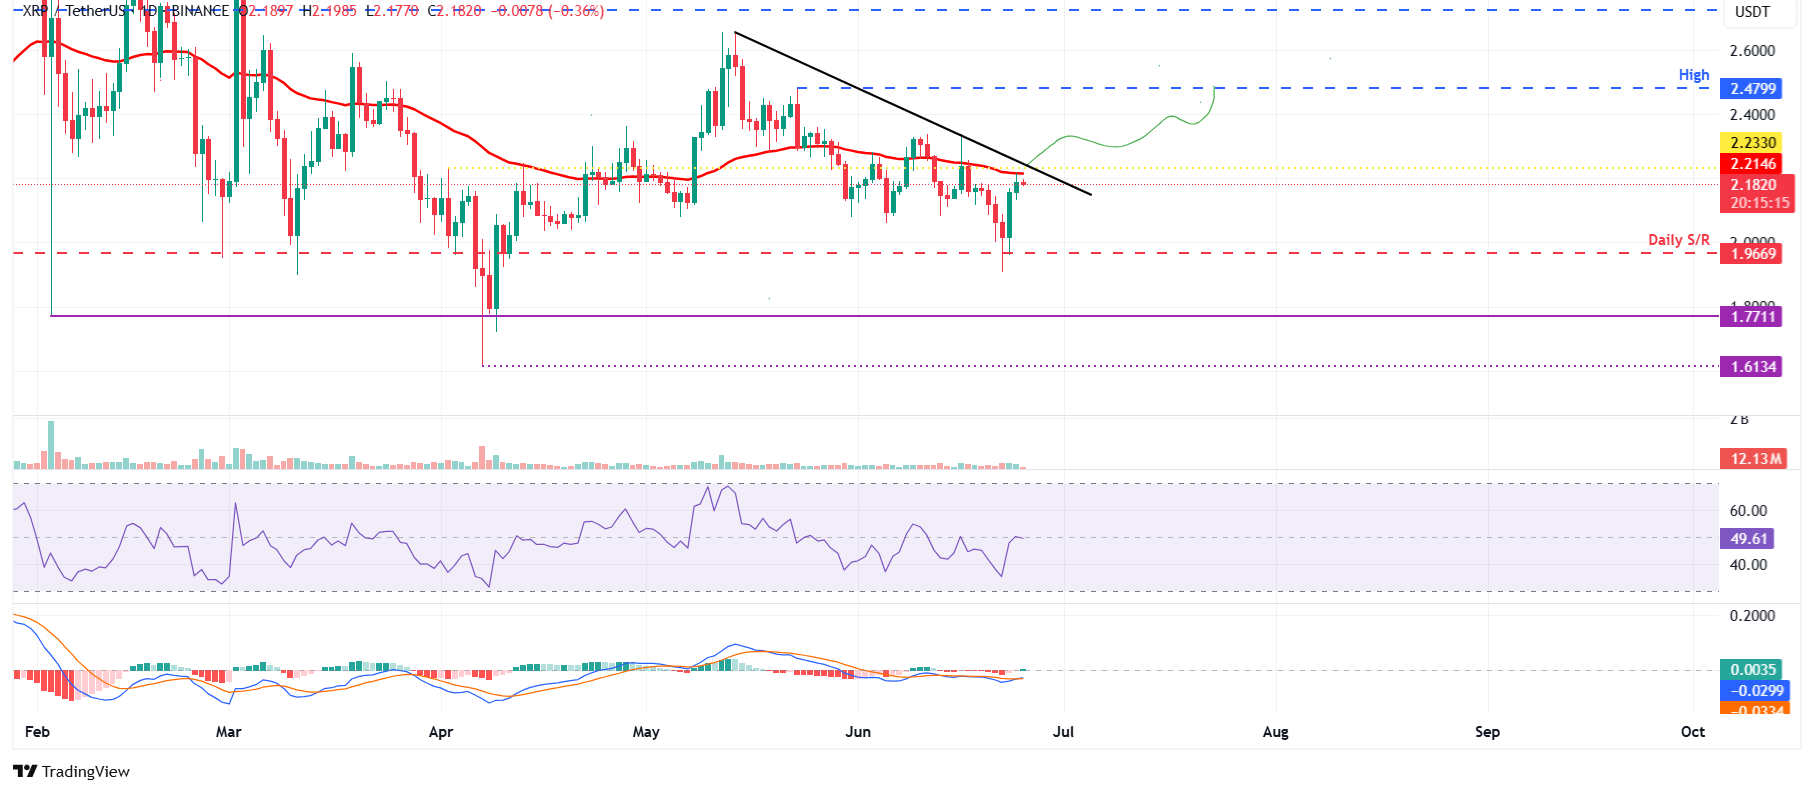
XRP/USDT daily chart
Conversely, if XRP faces rejection, it could extend the decline to retest its daily support at $1.96.


