


- Bitcoin price trades near $105,000 on Monday, after falling 3% in the previous week.
- Ethereum finds support near its 200-day EMA; a decisive close below could accelerate the downside correction.
- XRP faces resistance around the $2.23 daily level, suggesting a potential near-term pullback.
Bitcoin (BTC) continues to consolidate around the $105,000 mark, following a 3% decline last week. Ethereum (ETH) remains above a critical technical support level that could determine its near-term direction, while Ripple (XRP) is testing a key resistance level, increasing the odds of a pullback as bullish momentum wanes.
Bitcoin is heading toward $100,000 as bulls lose momentum
Bitcoin price closed below the daily support level of $106,406 on Thursday and declined by 1.50% the following day. However, it recovered slightly during the weekend. At the time of writing on Monday, it trades at around $105,000.
Suppose BTC faces resistance around the $106,406 daily level and continues its correction. It could extend the decline to revisit the psychologically important level of $100,000.
The Relative Strength Index (RSI) on the daily chart reads 53, pointing downward toward its neutral level of 50, indicating fading bullish momentum. The Moving Average Convergence Divergence (MACD) also showed a bearish crossover. It also shows rising red histogram bars below its neutral level, indicating a correction ahead.
BTC/USDT daily chart
However, if BTC recovers and closes above $106,406, it could extend the rally toward its all-time high of $111,980.
Ethereum could decline if it closes below its 200-day EMA
Ethereum price faced rejection at its $2,724 daily level on Thursday and declined by 5.7% the following day. However, it retested and found support around the 200-day Exponential Moving Average (EMA) at $2,456 during the weekend. At the time of writing on Monday, it trades slightly down, approaching its 200-day EMA.
If the 200-day EMA at $2,456 fails to hold as support, ETH could extend the decline to retest its next support level at $2,302, its 50-day EMA.
The RSI on the daily chart reads 54, having been rejected from its overbought level of 70 last week and points downward toward its neutral level of 50, indicating fading bullish momentum. The MACD indicator also displayed a bearish crossover, further underscoring the weakness in momentum and indicating a potential downward trend.
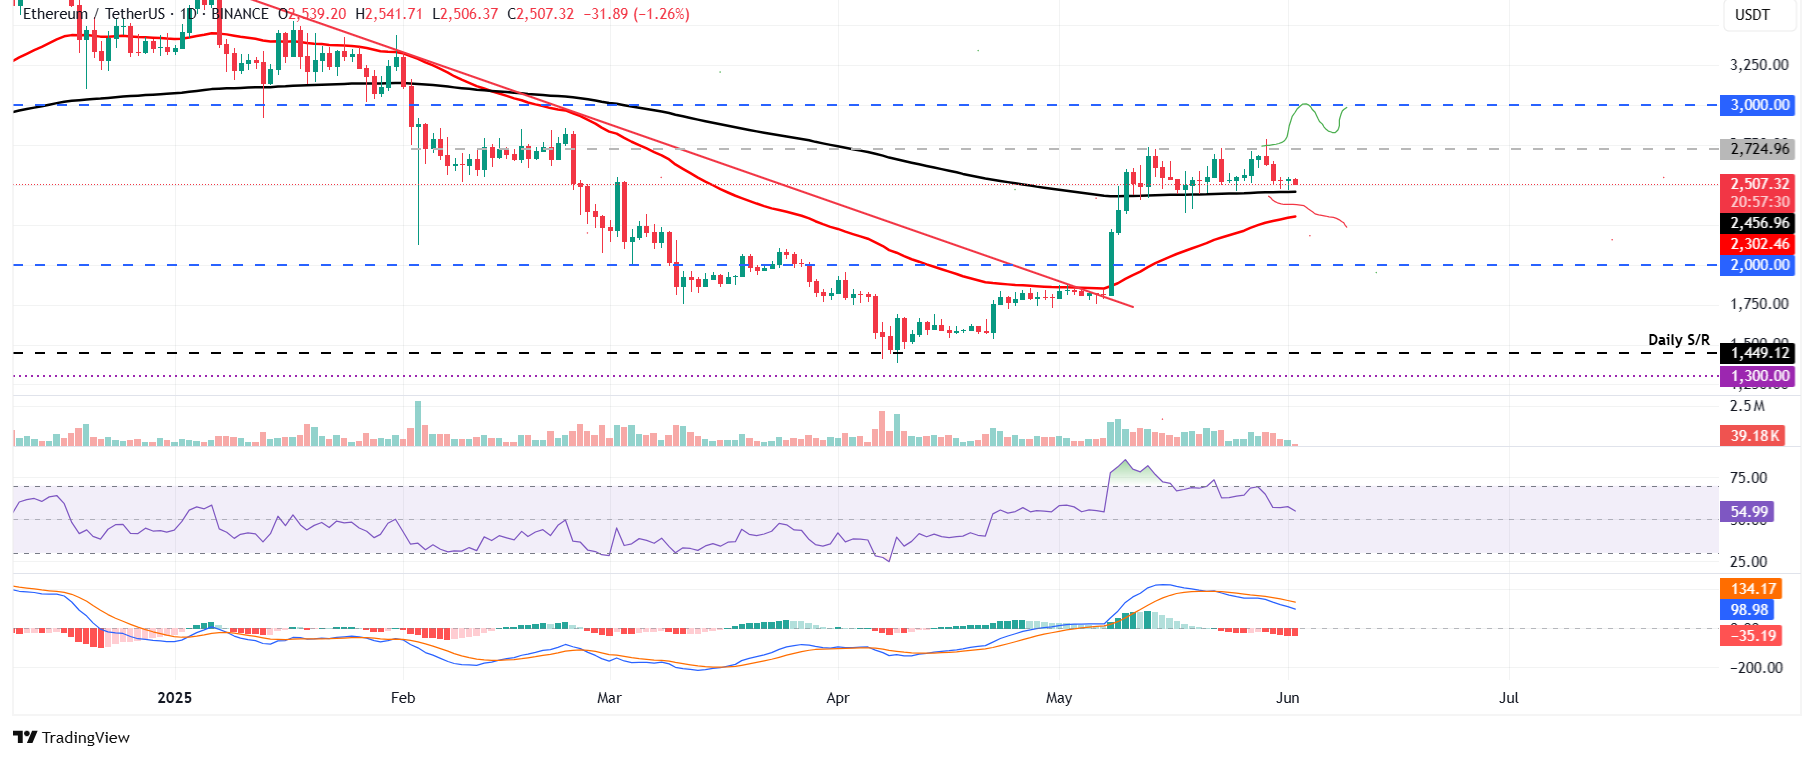
ETH/USDT daily chart
Conversely, if ETH breaks and closes above its $2,724 resistance on a daily basis, it could extend the rally to retest its psychologically important level at $3,000.
XRP faces a downleg as it closes below its $2.23 support level
XRP price closed below its daily support at $2.23 on Friday and declined by 4.65%. However, it stabilized below this daily level during the next two days. At the time of writing on Monday, it trades slightly down around $2.15.
If the daily level at $2.23 continues to hold as resistance, XRP price could decline to retest its next daily support at $1.96.
The RSI on the daily chart reads 39, below its neutral level of 50 and points downward, indicating strong bearish momentum. The MACD indicator also displayed a bearish crossover, further underscoring the weakness in momentum and indicating the continuation of a downward trend.
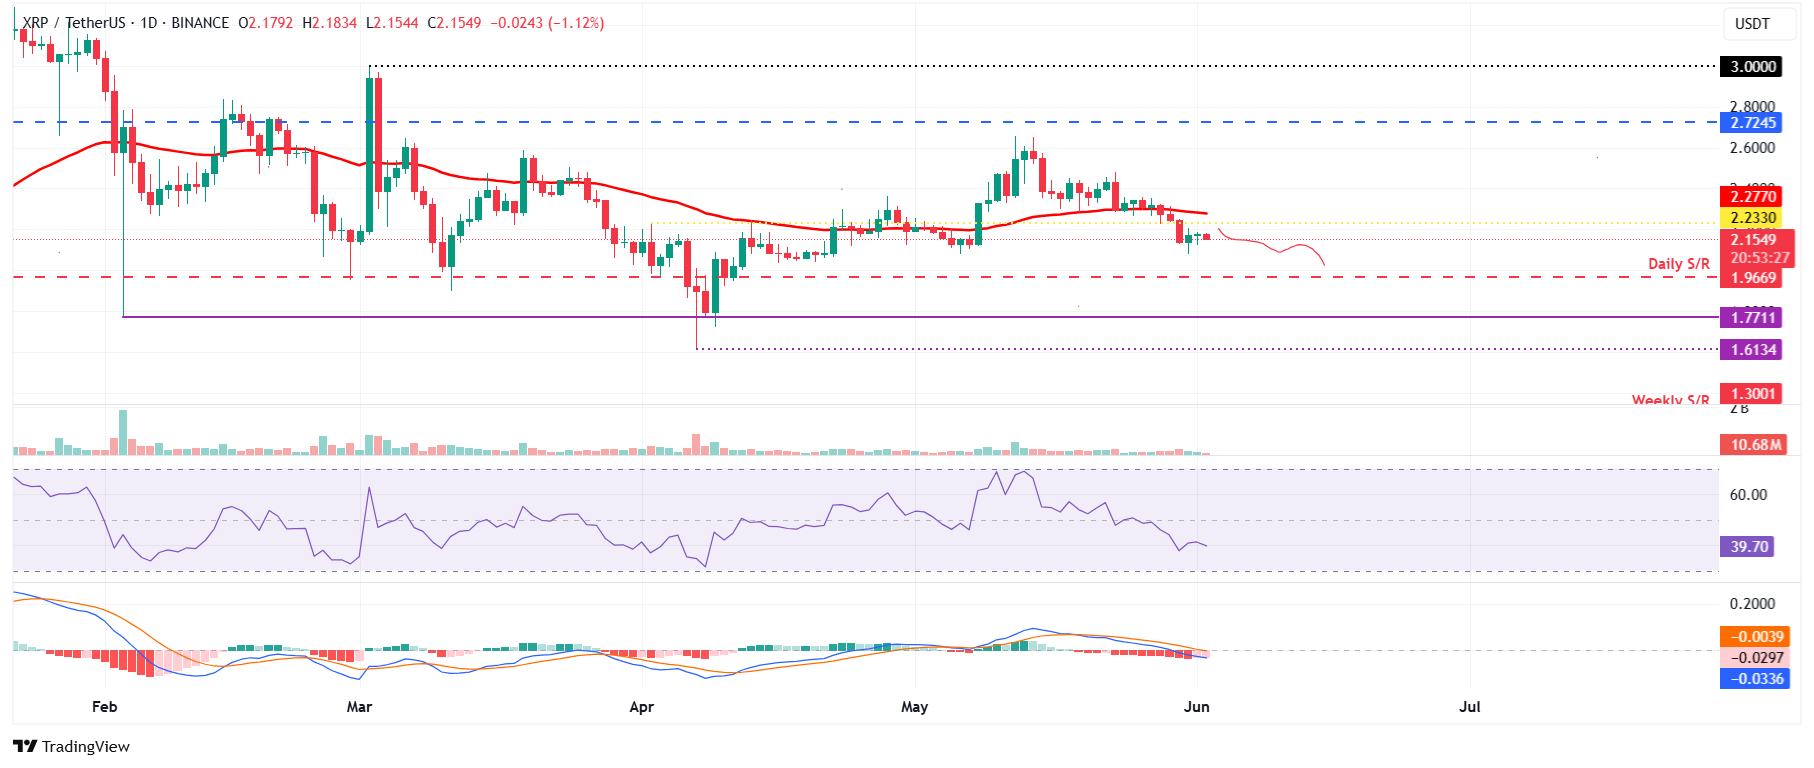
XRP/USDT daily chart
On the other hand, if XRP recovers, it could extend the recovery to retest its 50-day EMA at $2.27.
Bitcoin, altcoins, stablecoins FAQs
Bitcoin is the largest cryptocurrency by market capitalization, a virtual currency designed to serve as money. This form of payment cannot be controlled by any one person, group, or entity, which eliminates the need for third-party participation during financial transactions.
Altcoins are any cryptocurrency apart from Bitcoin, but some also regard Ethereum as a non-altcoin because it is from these two cryptocurrencies that forking happens. If this is true, then Litecoin is the first altcoin, forked from the Bitcoin protocol and, therefore, an “improved” version of it.
Stablecoins are cryptocurrencies designed to have a stable price, with their value backed by a reserve of the asset it represents. To achieve this, the value of any one stablecoin is pegged to a commodity or financial instrument, such as the US Dollar (USD), with its supply regulated by an algorithm or demand. The main goal of stablecoins is to provide an on/off-ramp for investors willing to trade and invest in cryptocurrencies. Stablecoins also allow investors to store value since cryptocurrencies, in general, are subject to volatility.
Bitcoin dominance is the ratio of Bitcoin’s market capitalization to the total market capitalization of all cryptocurrencies combined. It provides a clear picture of Bitcoin’s interest among investors. A high BTC dominance typically happens before and during a bull run, in which investors resort to investing in relatively stable and high market capitalization cryptocurrency like Bitcoin. A drop in BTC dominance usually means that investors are moving their capital and/or profits to altcoins in a quest for higher returns, which usually triggers an explosion of altcoin rallies.


