




Saturday, August 29, 2026
No Result
View All Result
  • Home
  • Market Overview
    • All
    • Crude Oil Prices
    • Cryptocurrency News
    • Economy News
    • ETFs
    • Foreign Exchange News
    • Indices
    • Stock Market

    UN Food Security Report Finds $540BN in Farm Subsidies Locked Into Commodities That Crowd Out Plant Foods – vegconomist

    AEGIS Hedging to Be Acquired by Private Equity at Goldman Sachs Alternatives

    Glencore plans large LME lead withdrawals after stocks surge, sources say

    AI Turns Competence into a Commodity: Evidence from 2.26 Million Freelance Contracts

    JPMAM adds commodities to lagging multi-asset strats

    New Houthi maritime strikes keep European gas futures pinned near multi-month peak

    • Crude Oil Prices
    • Cryptocurrency News
    • Economy News
    • ETFs
    • Indices
    • Stock Market
    • Foreign Exchange News
    • Commodities News
  • Forex Market
    • All
    • Central Banks News
    • Currencies
    • Interest Rate
    • Nonfarm Payroll

    Gold outlook hinges on Warsh speech as hawkish Fed stance may weigh | Markets News

    Nonfarm employment declined by 23,000 in July, with the unemployment rate rising to 4.1 percent, signaling a slowdown in the job market

    Peso may rebound after weak US payrolls report

    Gold Price Forecast: Cooling Fed Rate Hike Expectations Boost Appeal as Price May Hit $4,500?

    Forex Today: Market Focus Shifts from Middle East to US Nonfarm Payrolls

    Summertime job market remains muggy

    US labor market shows signs of weakness! July nonfarm payrolls unexpectedly decrease by 23,000; May and June data revised down sharply. Fed rate hike expectations cool down.

    Nonfarm payrolls down in July; unemployment rate eases to 4.1%

    US payrolls fall 23,000 in July in shock report; May, June figures sharply revised down

    • Central Banks News
    • Currencies
    • Interest Rate
    • Nonfarm Payroll
  • Commodities
    • All
    • Gold
    • Oil and Gas
    • Silver

    Silver Outlook: VC PMI and Cycle Date Analysis Point to Next Bullish Opportunity

    Silver analysis today

    Gold and Silver Market Correction 2026: Is the Bull Market Over?

    Silver Tracking Industrial Demand as Manufacturing and Inflation Shape Markets

    Silver VC PMI Outlook: Buy-Level Support Targets $61.51 Weekly Resistance

    Silver Tests Critical VC PMI Demand Zone as Cycle Window Hints Potential Reversal

    • Gold
    • Oil and Gas
    • Silver
  • Crypto
    • All
    • Bitcoin
    • Ethereum
    • Litecoin
    • Ripple
    • Solana
    • XRP

    Litecoin Price Prediction: Is LTC Heading Toward $40 After Trendline Breakdown?

    Ripple Launches Ripple Mint for Institutional RLUSD Access

    Litecoin Approaches Descending Channel Breakout as Technical Momentum Builds

    Ripple Launches Institutional Mint Platform for RLUSD Amid Transfer Volume Drop

    The ripple effects of farming injuries

    Litecoin Price Risks Drop to $35 if $43 Support Breaks

    • Bitcoin
    • Ethereum
    • Litecoin
    • Ripple
    • Solana
    • XRP
  • Charts
  • Economic Calendar
  • FX Analysis
    • EUR/USD
    • GBP/USD
No Result
View All Result
Home Market Overview Foreign Exchange News
2 months ago

Brent Rebounds as Strait of Hormuz Risks Grow. Forecast as of 14.07.2026

2026.07.14 2026.07.14
Brent Rebounds as Strait of Hormuz Risks Grow. Forecast as of 14.07.2026

Dmitri Demidenkohttps://www.litefinance.org/blog/authors/dmitri-demidenko/

logo

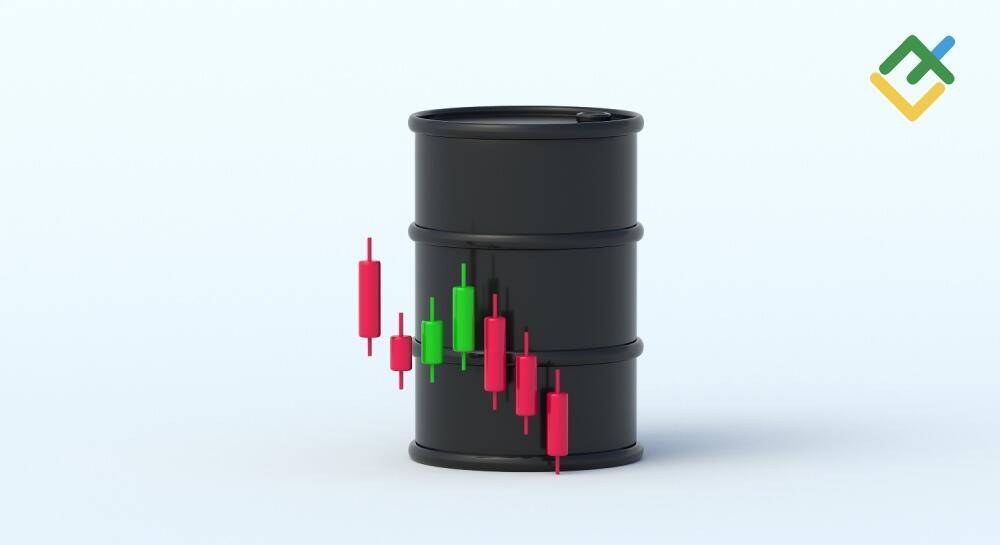
It took Brent just one week to recover the losses from the previous month. The escalating conflict in the Middle East is fueling bullish market sentiment, driving investors to buy Brent. Its near-term outlook remains clear. Let’s analyze the situation and develop a trading plan.

The article covers the following subjects:

Major Takeaways

  • China’s oil imports continue to fall.
  • Gulf states seek alternatives to the Strait of Hormuz.
  • Global demand growth is slowing.
  • Consider buying Brent, targeting $91 and $93.

Weekly Fundamental Forecast for Oil

Which came first, the chicken or the egg? Does the conflict in the Middle East move oil prices, or do swings in Brent shape the course of geopolitical tensions? Both Washington and Tehran have limits they cannot ignore. The US wants to avoid an inflation shock and a global economic downturn, while Iran depends on oil revenues to keep its regime afloat. The real question is where those limits lie.

Fear has taken over the market. Brent keeps rallying on the back of the NACHO narrative, or “Not A Chance Hormuz Opens.” Concerns over the sharp decline in traffic through the Strait of Hormuz, the world’s key oil shipping route, are overshadowing a host of bearish factors. Traders are largely ignoring the stronger US dollar, slowing global demand led by China, and growing export capacity through alternative routes.

Traffic Through the Strait of Hormuz

Source: Bloomberg.

OPEC expects oil demand growth to decelerate in 2026. In its latest forecast, OPEC expects demand to grow by 780,000 bpd, down from 970,000 bpd in its previous forecast. That is below the International Energy Agency’s forecast of 1 million bpd and the US Energy Information Administration’s estimate of 1.2 million bpd. The more cautious outlook reflects a sharp drop in Chinese oil imports. In June, imports fell 41% year over year to 29.27 million bpd, the lowest level since October 2016. That was 12% below the eight-year low recorded in May.

China’s Oil Imports


Source: Bloomberg.

Goldman Sachs has identified another bearish factor for Brent. According to the bank, additional pipeline capacity in the Gulf states could reduce the region’s dependence on the Strait of Hormuz by 45% by the end of 2027 and by 60% by the end of 2028. Skeptics, however, argue that building alternative routes is easier than protecting them from potential attacks.

Brent’s decline to prewar levels in early June gave Washington more room to maneuver. Lower oil prices allowed the US to resume military operations, supported by strong oil exports and still-sizeable strategic reserves. Even after falling to 316.5 million barrels, those reserves remain substantial despite being at their lowest level since the 1980s.

US Strategic Oil Reserves

Source: Bloomberg.

Washington knows how this story is likely to unfold. As in late February, Brent is expected to rally on market sentiment before traders gradually shift their focus back to bearish fundamentals. That should limit further gains, making it unlikely that Brent will break above $100 per barrel and hold those levels for long.

Weekly Trading Plan for Brent

Given the current oil market conditions, it is advisable to add to long trades during pullbacks at the lower boundary of the $70–$80 range. Target levels can be raised to $91 and $93.


This forecast is based on the analysis of fundamental factors, including official statements from financial institutions and regulators, various geopolitical and economic developments, and statistical data. Historical market data are also considered.

Price chart of UKBRENT in real time mode

The content of this article reflects the author’s opinion and does not necessarily reflect the official position of LiteFinance broker. The material published on this page is provided for informational purposes only and should not be considered as the provision of investment advice for the purposes of Directive 2014/65/EU.


According to copyright law, this article is considered intellectual property, which includes a prohibition on copying and distributing it without consent.

Rate this article:

{{value}} ( {{count}} {{title}} )

Source: Original Article

RelatedPosts

Market Overview

UN Food Security Report Finds $540BN in Farm Subsidies Locked Into Commodities That Crowd Out Plant Foods – vegconomist

July 22, 2026
Market Overview

AEGIS Hedging to Be Acquired by Private Equity at Goldman Sachs Alternatives

July 22, 2026
Market Overview

Glencore plans large LME lead withdrawals after stocks surge, sources say

July 22, 2026
Forex Market

Forex Today: Market Focus Shifts from Middle East to US Nonfarm Payrolls

August 7, 2026
Forex Market

Summertime job market remains muggy

August 7, 2026
Forex Market

US labor market shows signs of weakness! July nonfarm payrolls unexpectedly decrease by 23,000; May and June data revised down sharply. Fed rate hike expectations cool down.

August 7, 2026
Forex Market

Nonfarm payrolls down in July; unemployment rate eases to 4.1%

August 7, 2026
Next Post

Commodity Markets Rotate in 2026 as Lithium and Oil Lead, Gold Cools - Article

Arm Holdings PLC Stock (ARM) Moved Down by 5.83% on Jul 14: A Full Analysis

Will June inflation data affect interest rates?

Market News Board | Market Analysis,Charts & News

MarketNewsBoard delivers trusted financial news, real-time market analysis, interactive charts, and economic insights across the global financial markets.

Covering Forex, Commodities, Stocks, Indices, Cryptocurrencies, and major economic events...

Market Overview

  • Forex Market
  • Commodities
  • Cryptocurrency News
  • Stocks
  • Indices
  • Crude Oil Prices
  • Economic Calendar

Resources

  • Central Banks News
  • Economy News
  • Interest Rate
  • Nonfarm Payroll
  • Charts

Tools

  • Currency Heat Map
  • Correlation Matrix
  • Market Sentiment
  • Currency Cross Rates
  • Crypto Rates
  • About Us
  • Contact Us
  • Disclaimer
  • Privacy Policy
  • Terms and Conditions

© 2026 MarketNewsBoard | Market Analysis, Charts & News.

AAPL
$319.70
AMZN
$266.43
BTC-USD
$77,582.44
EURUSD=X
$1.16
DX-Y.NYB
$99.68
NVDA
$217.55
TSLA
$348.75
DOW
$30.51
^N225
$66,405.56
JPY=X
$160.04
GBPUSD=X
$1.35
CAD=X
$1.39
NG=F
$2.89
BZ=F
$88.10
NFLX
$81.72
GOOG
$342.88
MSFT
$513.53
^RUT
$2,972.37
^FTSE
$10,824.26
AUDUSD=X
$0.716
CHF=X
$0.809
HG=F
$6.66
ETH=F
$2,443.50
No Result
View All Result
  • Home

© 2026 MarketNewsBoard | Market Analysis, Charts & News.