






















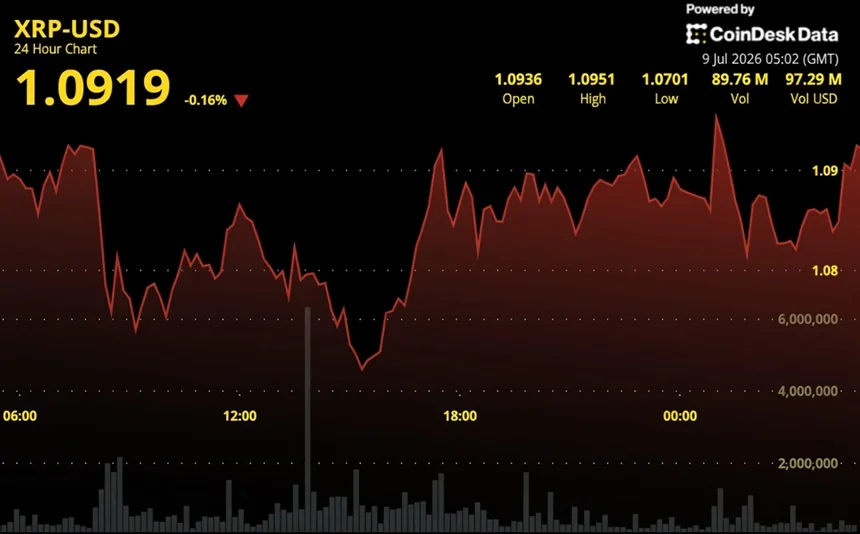
XRP is trading at $1.09 as of July 9, 2026, and the $1.00–$1.05 support zone has now survived three straight weeks of selling pressure, according to CoinDesk analysis. That floor matters. On June 26, the token slipped to $1.009, its lowest level since November 2024 and roughly 70% below its $3.65 peak in July 2025. Buyers have kept stepping in. The question now is whether they can push through the $1.20–$1.25 resistance band that would confirm something bigger than a bounce.s
Why 830 Million XRP Sits Between $1.00 and $1.06
The XRP support level at $1.00 is not just a round number. Cost-basis data shows roughly 830 million XRP last changed hands at prices between $1.00 and $1.06, creating a wide band of holders defending their entry. Below it, the chart thins out fast, with little structural support until $0.87, and some analysts flag $0.80 as the next meaningful zone if the floor gives way.
On-chain flows back the bulls, at least for now. Net outflows from exchanges increased from about 40.7 million XRP in late June to roughly 123 million, suggesting buyers are pulling supply off exchanges rather than positioning to sell. Spot XRP ETF inflows have run positive for eight consecutive weeks, with cumulative net inflows near $1.47 billion. As we noted when Goldman Sachs unwound its $154 million XRP ETF position in May, organic demand absorbed that exit without breaking the price. The demand base is real. It just has not moved the chart yet.
The $1.18–$1.25 Wall Standing Between XRP and a Trend Change
Resistance starts at $1.10, where the upper boundary of a descending channel that dates back to July 2025 currently sits. Above that, the 50-day EMA near $1.18 and the psychological $1.30 level have capped every recovery attempt this year. Roughly 22.8 million XRP cluster in the $1.18–$1.19 band alone, meaning plenty of underwater holders are waiting to sell into any rally.
Momentum is improving but unconvincing. The RSI sits near 44, below neutral, while the MACD has turned modestly positive. Traders on Polymarket currently assign about a 70% probability that XRP finishes July above $1.20, though odds of a move past $1.60 sit in the low single digits. Seasonality also helps the bulls, as July has historically been one of XRP’s strongest months, averaging returns of nearly 10%.
CLARITY Act Delayed to Late July, and the Chart Takes Over
The one catalyst that could force a decision has been delayed. The CLARITY Act missed its July 4 target, and with the Senate back on July 13 and a defense bill first in the queue, a floor vote now looks like late July or early August. When the bill cleared the Senate Banking Committee in May, XRP jumped 4.5% in a day. Standard Chartered, which cut its 2026 XRP price target from $8 to $2.80 in February, kept its 2030 forecast at $28, a reminder of how wide the institutional range remains.
Until the Senate moves, the chart decides. Hold $1.00, reclaim $1.20, and the downtrend that began a year ago comes under real pressure. Lose the floor, and $0.87 comes into view quickly.
Author: Ayanfe Fakunle
This article is most definitely not financial advice.
See Also:
Source: Original Article