

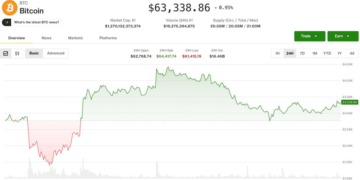
























Ripple (XRP) edges lower while trading around $1.13 at the time of writing on Tuesday. The remittance token upholds a broader bearish bias, attributed to softening retail interest and the lack of strong catalysts to prevent rallies from being sold as investors appear to prefer short-term gains.
Ripple eyes European region expansion with MiCa’s license
Ripple announced on Monday that it had been granted authorization for a Crypto Asset Service Provider (CASP) license from Luxembourg’s Commission de Surveillance du Secteur Financier (CSSF).
This authorization, building on the preliminary approval granted in June 2026, affirms Ripple’s full compliance with the Markets in Crypto-Assets (MiCA) regulation.
Ripple’s comprehensive, regulated crypto payments solution is now accessible to financial institutions, corporations, and enterprises throughout the 30-nation European Economic Area (EEA).
“This CASP authorisation means Ripple enters the post-transitional MiCA era fully compliant and ready to scale,” said Cassie Craddock, Managing Director, United Kingdom & Europe at Ripple.
Falling retail demand constrains XRP’s outlook
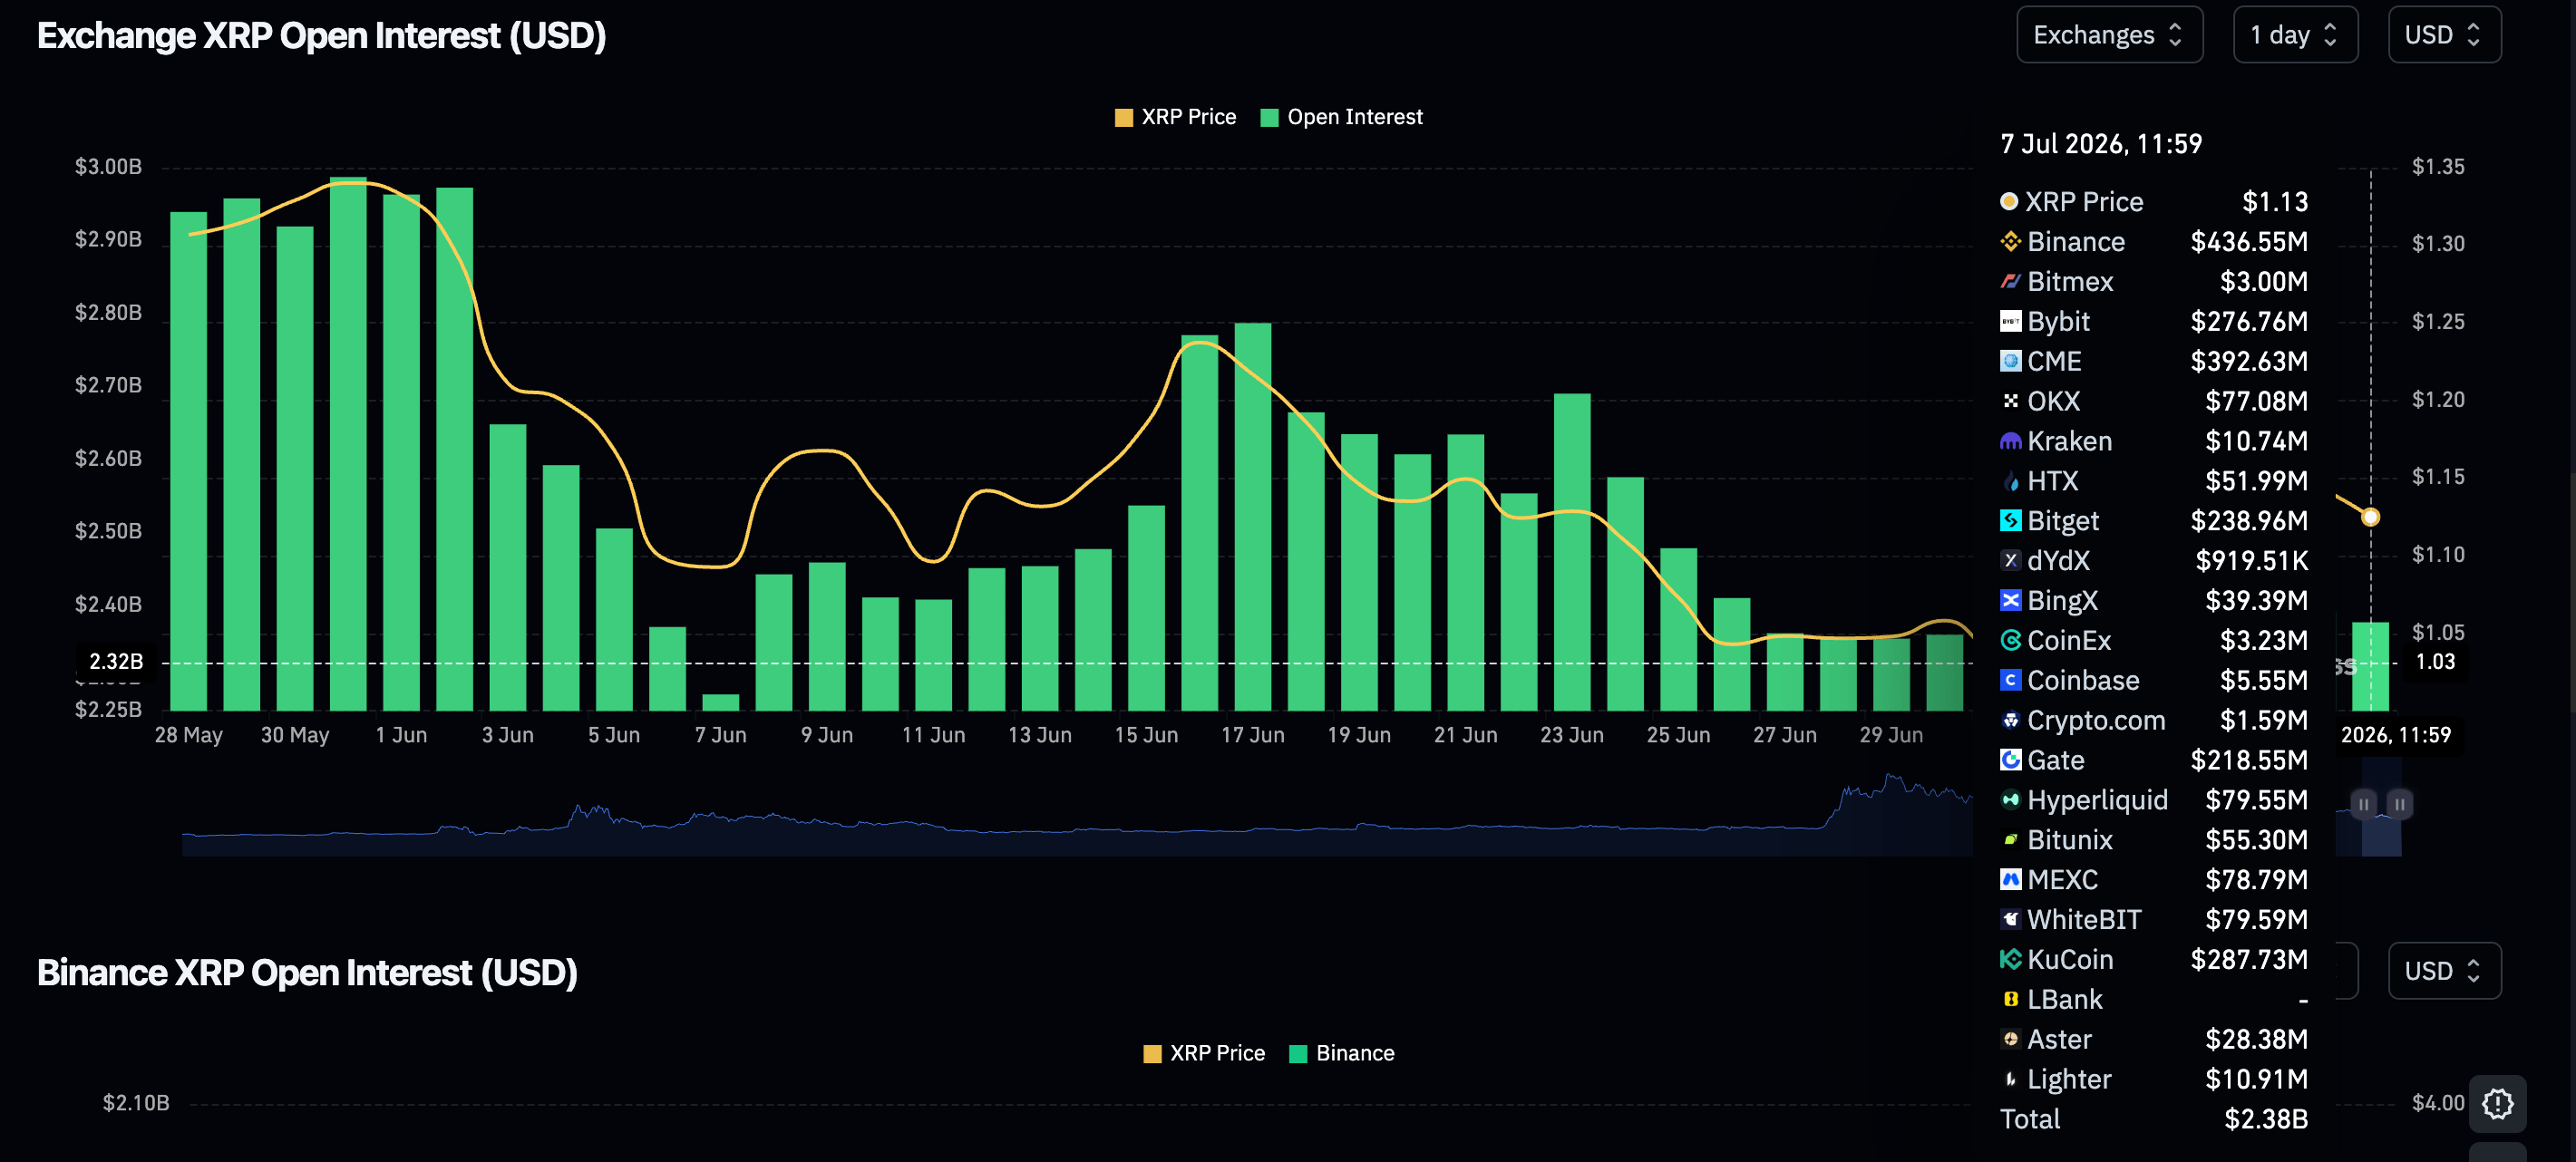
The XRP derivatives market continues to face persistent cooling in retail demand, as reflected in the perpetual futures Open Interest (OI). According to CoinGlass data, the OI has cooled further to $2.38 billion on Tuesday, down from $2.39 billion on Monday and $2.58 billion on Sunday.
An expanded outlook indicates that current retail activity pales significantly in comparison to the OI peak of $10.94 billion on July 22. If this weakness sustains, recovery could remain a pipe dream in the short term amid investor exhaustion.
Price analysis: XRP retains a near-term bearish bias
XRP holds inside a downward parallel channel with a bearish near‑term bias as price remains capped beneath the 50-day, the 100-day and the 200-day Moving Average Exponential (EMA) cluster. The Parabolic SAR at $1.02 sits below spot, hinting at tentative underlying support, while the Relative Strength Index (RSI) has cooled back toward the mid-40s, suggesting fading bullish momentum after the recent bounce.
Meanwhile, the Moving Average Convergence Divergence (MACD) histogram is marginally positive but flattening on the daily chart, which reinforces the view of a waning recovery rather than a sustained uptrend.
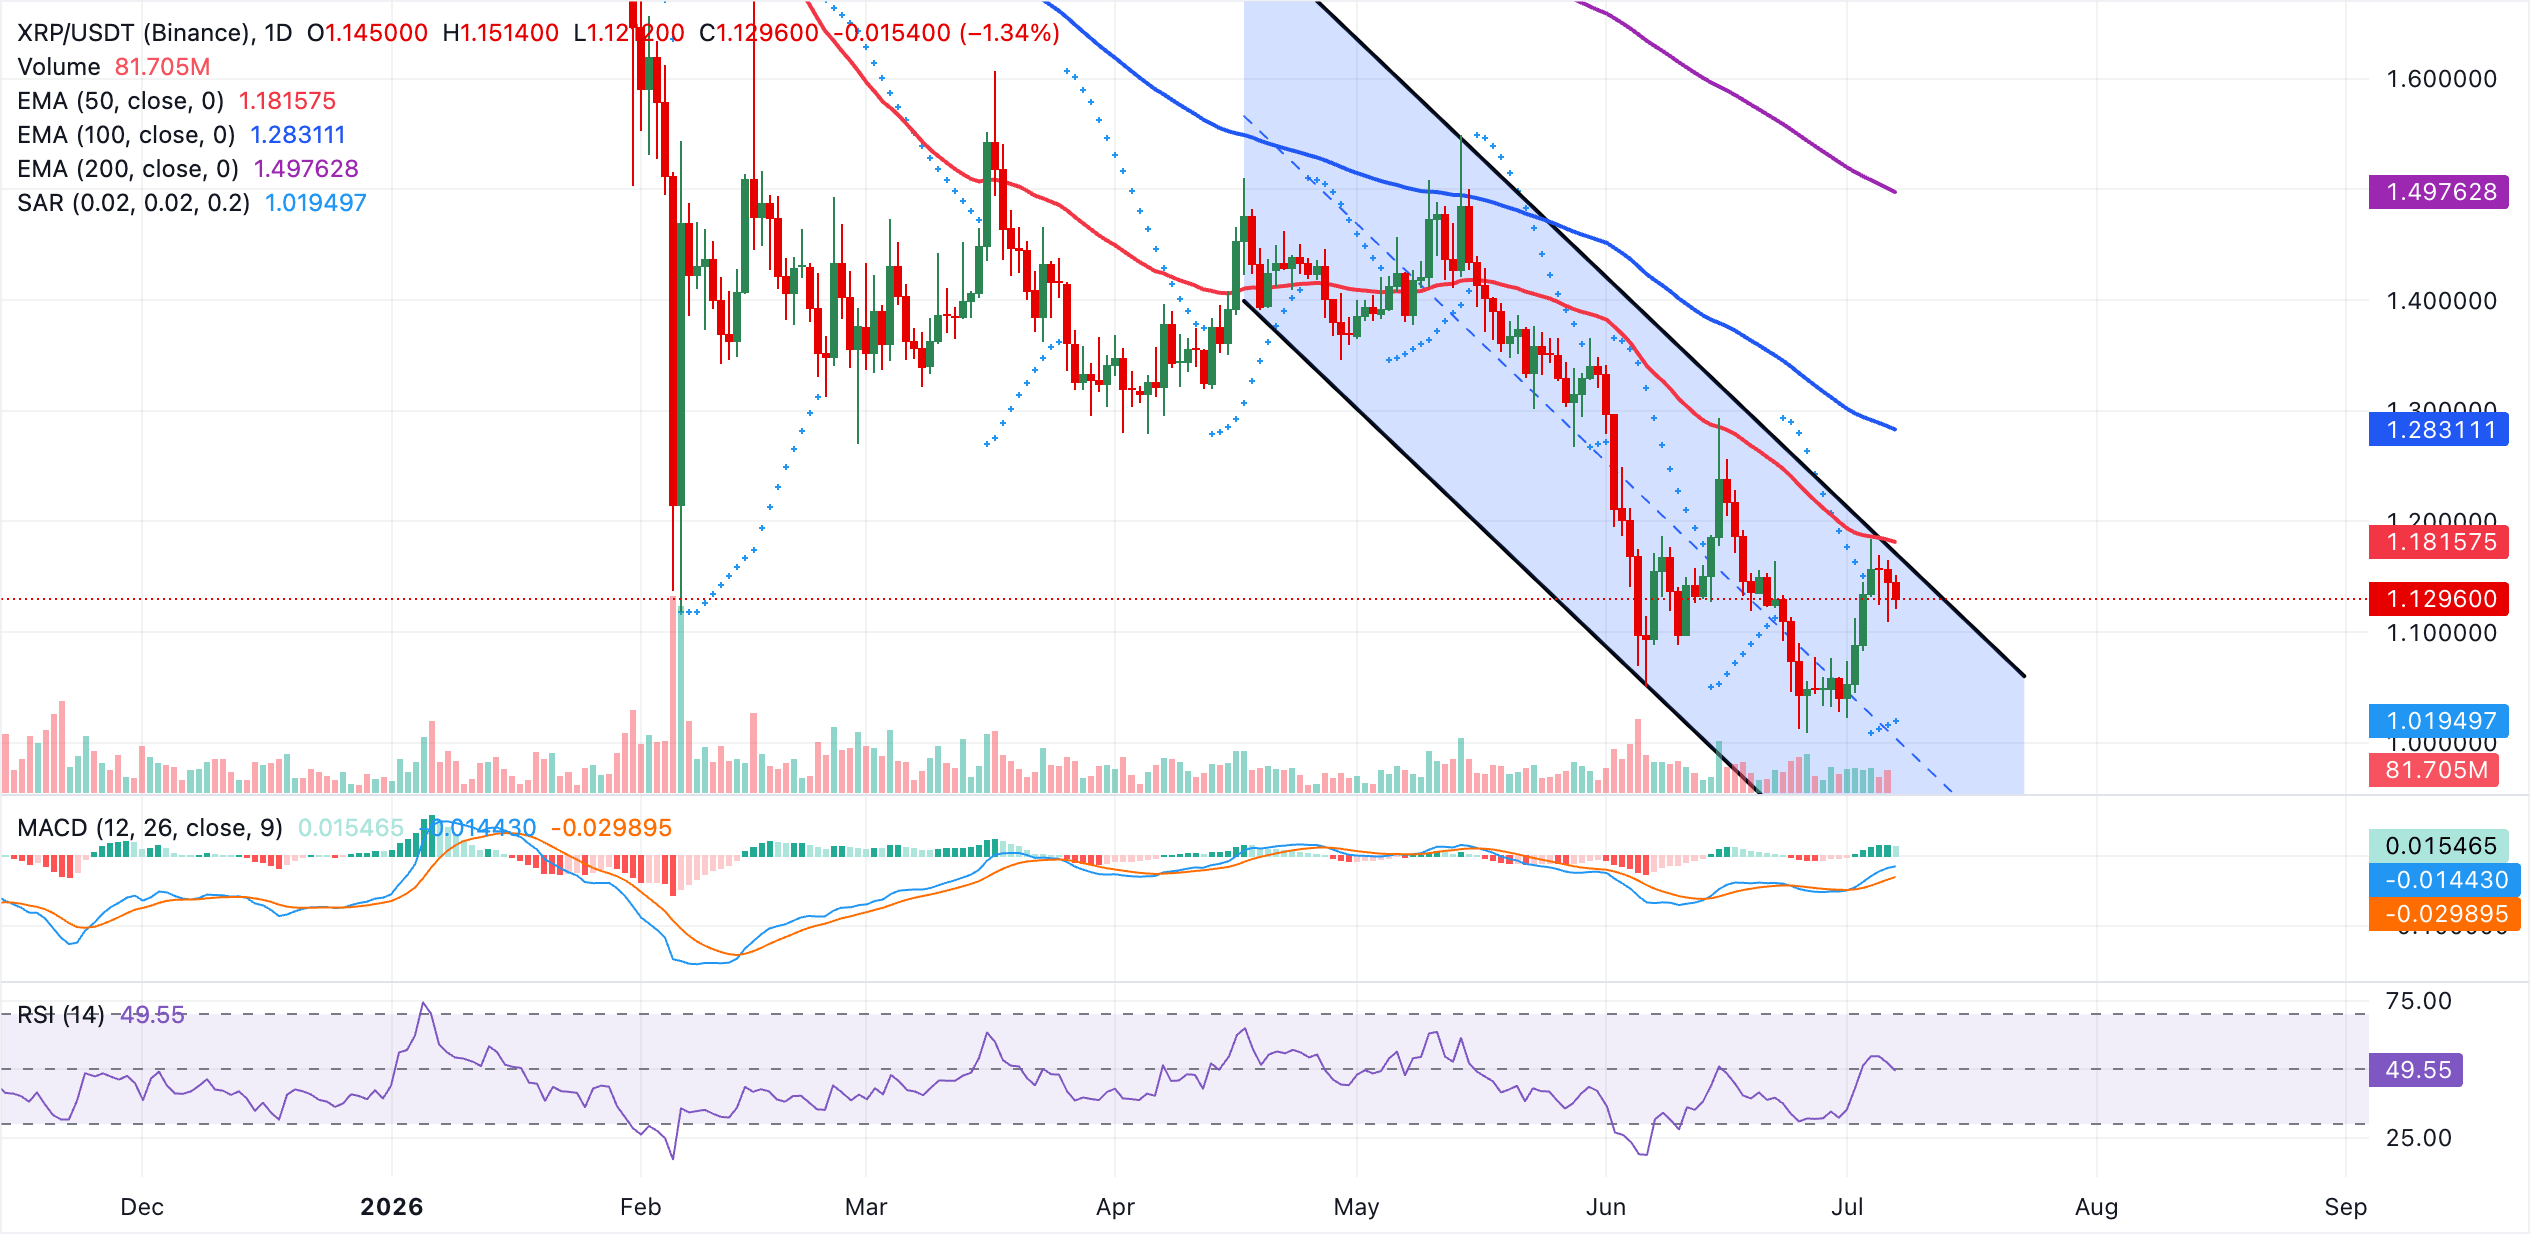
On the topside, initial resistance is aligned with the channel top near $1.17, followed by the 50-day EMA at $1.18, with the 100-day EMA at $1.28 and the distant 200-day EMA at $1.50 marking progressively stronger barriers within the broader downtrend. On the flip side, immediate support is seen near the recent pivot around the current price region, ahead of the Parabolic SAR at $1.02, while a deeper slide would expose the channel floor toward $0.84 as the next major demand zone.
(The technical analysis of this story was written with the help of an AI tool. Know more.)
Source: Original Article