




















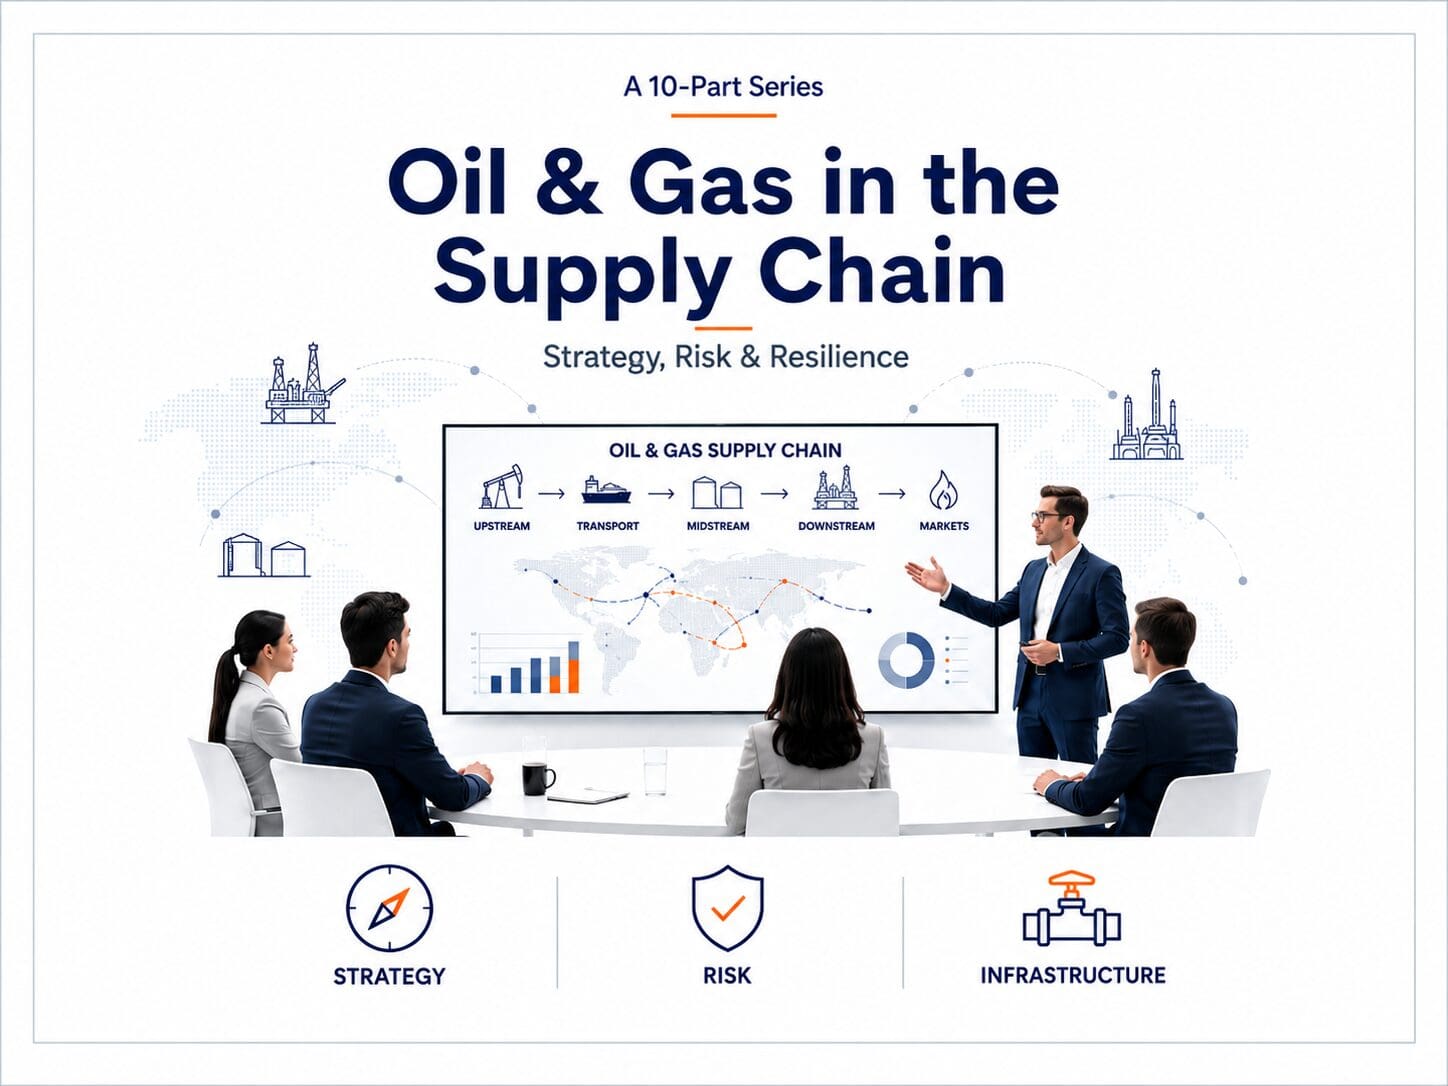
Oil and gas supply chains occupy a distinctive position in global commerce. They are simultaneously physical, financial, industrial, and geopolitical systems. A production basin, pipeline corridor, storage hub, LNG terminal, refinery, marine terminal, or petrochemical complex is not simply an operating asset. It is a node in a broader network where geology, infrastructure, regulation, commercial demand, and capital markets interact.
This is why oil and gas supply chains are difficult to redesign quickly. Reservoirs are fixed. Pipelines follow established corridors. Refineries are configured around specific crude slates and product requirements. LNG terminals take years to permit and build. Storage is finite. Marine assets are specialized. Product specifications vary by region and end market. The system has been engineered for scale and efficiency, but that same engineering creates rigidity.
When conditions are stable, this rigidity can support low unit costs and reliable flows. When conditions change, it becomes a source of exposure. A disruption at a single terminal, pipeline, port, refinery, or shipping lane can ripple across regions. For supply chain leaders, the central issue is no longer simply whether product can be produced. It is whether product can move, be stored, meet specification, clear regulatory requirements, and reach the right market at the right time.
The New Geography of Oil and Gas Flows
The global oil and gas map has changed materially over the past two decades. U.S. shale reshaped crude and natural gas balances. LNG expanded the reach of gas markets and introduced more optionality, but also more exposure to global price signals and shipping constraints. Asian demand altered trade lanes and investment priorities. European energy security concerns changed procurement strategies and increased the importance of supply diversification. Middle Eastern producers remain central to crude supply, while Latin America and Africa continue to offer major resource potential that is often constrained by infrastructure, financing, or political risk.
The result is a system that is more flexible than the older point-to-point model, but also more exposed. Crude oil movements are shaped by production levels, sanctions, storage, shipping availability, refinery demand, and quality specifications. Natural gas flows depend on gathering systems, processing capacity, pipeline networks, liquefaction, regasification, and seasonal demand. Refined products depend on refinery utilization, blending rules, regional fuel standards, inventory positions, and last-mile distribution networks. Petrochemical flows depend on feedstock availability, plant reliability, downstream demand, marine logistics, and packaging or container networks.
In practical terms, oil and gas supply chains are now multi-directional networks. Every major node sits inside a larger operating system whose performance depends on capacity, timing, quality, regulation, and optionality. This changes the work of supply chain management. It requires leaders to understand not just what is moving, but why it is moving, where it can be redirected, and which constraints will determine the commercial outcome.
Price Volatility Is a Supply Chain Issue
Oil and gas price volatility can move faster than the physical supply chain can respond. Crude prices, natural gas prices, diesel cracks, jet fuel margins, LNG spot prices, NGL spreads, and petrochemical feedstock costs can shift rapidly. A crude cargo purchased under one margin assumption may arrive under another. A refinery optimized for one crude slate may find that the economics have changed before the crude reaches the dock. A pipeline bottleneck can widen regional differentials. An LNG cargo may be diverted when regional demand or price signals shift. A petrochemical producer may face margin compression when feedstock volatility moves faster than customer pricing.
This makes supply chain visibility a financial capability. Companies that understand their flows, constraints, inventory positions, transportation options, storage alternatives, and product specifications can make better commercial decisions. Companies that rely on fragmented data, manual planning, or lagging reports operate with unnecessary exposure.
The most effective organizations do not simply report what happened after the fact. They continuously evaluate how physical constraints affect commercial decisions. They connect trading, scheduling, logistics, operations, engineering, finance, and customer commitments. They understand that margin is protected not only through price management, but through operational optionality.
Infrastructure Constraints Define Commercial Outcomes
Infrastructure is one of the most important determinants of oil and gas economics. Production has limited value if it cannot reach market. Gas may remain stranded or discounted if gathering, processing, pipeline, or LNG capacity is unavailable. Refined products only create value if they can move to demand centers and meet local specifications. Petrochemical feedstocks only translate into margin if downstream assets, customers, transportation providers, and packaging networks are synchronized.
The most consequential bottlenecks tend to appear in familiar places. These include pipeline capacity, storage availability, terminal congestion, port access, refinery configuration, LNG liquefaction, regasification capacity, vessel availability, railcar supply, truck capacity, power availability, permitting delays, and critical equipment lead times. Each constraint may appear technical, but the impact is commercial. It determines where product can move, when it can move, how much value can be captured, and how quickly the enterprise can respond during disruption.
For executives, the implication is clear: infrastructure should not be treated as a static assumption. It should be modeled as a dynamic constraint. Capacity may be available in one season and constrained in another. A terminal may be sufficient under normal conditions but become a bottleneck during a disruption. A refinery configuration may be profitable under one crude slate and less attractive under another. A port may offer export optionality until vessel queues, weather, or regulatory delays alter the economics.
Managing these constraints requires better data, stronger scenario planning, and tighter coordination across commercial, operational, and engineering teams. It also requires a common language for risk. The same bottleneck may be described differently by traders, schedulers, engineers, and supply chain planners. Leadership needs an integrated view of constraints and their financial implications.
Regional Divergence Requires Local Execution
Oil and gas supply chains are increasingly regionalized by policy, infrastructure, and market conditions. A single global strategy is rarely sufficient. Companies need enterprise standards, but execution must reflect the realities of each region.
North America is shaped by shale production, pipeline constraints, LNG exports, refining complexity, methane regulation, and regional power constraints. Europe is shaped by gas security, carbon policy, import dependency, refining rationalization, industrial competitiveness, and energy affordability. Asia is shaped by demand growth, LNG procurement, petrochemical expansion, long-term energy security strategy, and import infrastructure development. The Middle East is shaped by upstream scale, export infrastructure, integrated refining, petrochemical growth, and strategic control of global energy flows. Latin America and Africa are shaped by resource opportunity, infrastructure gaps, financing constraints, export potential, and regulatory variability.
This regional fragmentation creates management complexity. A policy shift in one market can change procurement behavior in another. A refinery outage can affect product flows across multiple regions. An LNG constraint can move gas prices and industrial costs far from the original bottleneck. A shortage of vessels, railcars, drivers, or terminal slots can alter the economics of an otherwise sound commercial plan.
Supply chain leaders therefore need a global operating model with region-specific execution. Common data definitions, governance, risk methods, and performance metrics matter. But so does local knowledge of infrastructure, regulation, counterparties, weather patterns, port constraints, labor conditions, and customer requirements.
Executive Questions for Oil and Gas Leaders
Oil and gas executives should treat supply chain exposure as a board-level question. The right discussion is not limited to cost reduction or service performance. It is about resilience, margin protection, market access, and strategic flexibility.
Several questions deserve regular executive attention:
- Where are our most material supply chain constraints? Leaders need to know which physical limitations most affect margin and growth.
- Which flows are most exposed to price volatility? Exposure can sit in crude, gas, products, LNG, NGLs, feedstocks, or logistics capacity.
- Which assets depend on single routes, suppliers, terminals, or modes? Single points of failure often remain hidden until disruption occurs.
- How quickly can we reroute crude, product, LNG, or feedstocks? Optionality has value only if it can be executed in time.
- Do we understand inventory, storage, and transportation alternatives in real time? Static reports are insufficient when markets move quickly.
- Can commercial decisions be connected to physical constraints quickly enough to protect margin? The gap between market signal and operational response is where value is often lost.
- Which infrastructure limitations most constrain growth or market access? Capital allocation should reflect the constraints that matter most.
- Where do we lack verified emissions or product traceability data? Environmental and product transparency requirements are becoming part of market access.
These questions are not academic. They determine whether a company can respond when market assumptions change, logistics capacity tightens, a route is disrupted, a regulation shifts, or a customer requirement becomes more demanding.
Supply Chain Control Is Margin Control
In oil and gas, supply chain control is margin control. The companies best positioned for volatility will be those that understand their physical networks in operational detail and can connect those realities to commercial decisions. They will know where their constraints are, where optionality exists, and where investment is required. They will treat visibility, scenario planning, infrastructure modeling, and cross-functional coordination as core capabilities rather than support functions.
The global oil and gas system will remain complex, capital intensive, and regionally fragmented. But complexity does not have to mean opacity. Leaders that build a clearer view of flows, constraints, costs, specifications, and risk will be better positioned to protect margin and serve customers in a more volatile energy landscape.
To explore these issues in greater depth, Download the full ARC Advisory Group white paper for additional perspective on oil and gas supply chain strategy, risk, and operational resilience.
AI Is Reshaping Supply Chain Execution. Here’s What Comes Next.
Two ARC Advisory Group white papers on the next stage of AI in supply chain operations.
AI is moving beyond isolated copilots and technical architecture into coordinated operational decision systems. This ARC Advisory Group white paper explains how supply chain AI is shifting from capability to execution, where context, governance, workflows, thresholds, and action pathways determine whether AI improves real decisions across planning, logistics, sourcing, fulfillment, and risk management.
Download Our Featured White Paper:
AI in the Supply Chain Part II: From Architecture to Execution – Defining the Decision Intelligence Layer in Modern Supply Chain
Download Our Foundational White Paper:
AI in the Supply Chain: Architecting the Future of Logistics with A2A, MCP, and Graph-Enhanced Reasoning
Explore Our Domains
Planning, Execution & Visibility | Transportation & Logistics Operations | Warehousing, Fulfillment & Automation | Global Trade & Compliance | AI & Advanced Analytics | Data, Integration & Interoperability | Supply Chain Platforms | Risk & Resilience | Sustainability & ESG
Independent ARC research for supply chain leaders and technology decision-makers.
Source: Original Article