Monday, June 29, 2026
Market News Board | Market Analysis,Charts & News
No Result
View All Result
  • Home
  • Market Overview
    • All
    • Crude Oil Prices
    • ETFs
    • Indices
    • Stock Market
    (FCQH) Market Performance Analysis

    (FCQH) Market Performance Analysis

    Korea’s ETF market overtakes Kosdaq for 1st time

    Korea’s ETF market overtakes Kosdaq for 1st time

    Triple-digit heat indices possible to end June and start July

    Triple-digit heat indices possible to end June and start July

    Here are 3 big things we’re watching in the stock market in the week ahead

    Here are 3 big things we’re watching in the stock market in the week ahead

    Pakistan considers importing ‘cheaper’ oil and gas from Iran

    Pakistan considers importing ‘cheaper’ oil and gas from Iran

    Top analysts bullish on these stocks for long-term growth potential

    Top analysts bullish on these stocks for long-term growth potential

    • Economy News
    • Cryptocurrency News
    • Stock Market
    • Crude Oil Prices
    • ETFs
    • Indices
  • Forex Market
    • All
    • Central Banks News
    • Currencies
    • Fed Interest Rate Decision
    • Nonfarm Payroll
    Invesco Survey: 61% of Central Banks Say US Debt Hurts Dollar’s Reserve Status – News and Statistics

    Invesco Survey: 61% of Central Banks Say US Debt Hurts Dollar’s Reserve Status – News and Statistics

    Lite Strategy leads $1 million investment in LitVM to build Litecoin Layer 2 network

    Important Data Preview for Next Week: Beware of the “Data Tsunami Week”; the Nonfarm Payrolls Data Will Be Released Early on July 2

    Interest Rate Forecast: USDJPY Eyes 162 Breakout as Fed and BOJ Diverge

    Interest Rate Forecast: USDJPY Eyes 162 Breakout as Fed and BOJ Diverge

    The Week Ahead: Jobs Data, Fed Signals and Middle East Risks Take Center Stage

    The Week Ahead: Jobs Data, Fed Signals and Middle East Risks Take Center Stage

    BIS Warns ‘Pressure Points’ Putting Global Economy at Risk – Other Media news

    BIS Warns ‘Pressure Points’ Putting Global Economy at Risk – Other Media news

    Treasury yields edge lower as kashkari backs rate increase

    Treasury yields edge lower as kashkari backs rate increase

    • Fed Interest Rate Decision
    • Nonfarm Payroll
    • Currencies
    • Central Banks News
  • Commodities
    • All
    • Gold
    • Oil and Gas
    • Silver
    Gold, Silver and Crude Oil Outlook: Key Levels and Market Movers

    Silver Technical Outlook: VC PMI, Cycle Analysis Signal Potential Bullish Breakout

    Pakistan considers importing ‘cheaper’ oil and gas from Iran

    Pakistan considers importing ‘cheaper’ oil and gas from Iran

    Gold prices stabilize in Baghdad, decline in Erbil – Shafaq News

    Gold prices stabilize in Baghdad, decline in Erbil – Shafaq News

    AI Is Turning Knowledge Into A Commodity. Here’s What Matters Now

    AI Is Turning Knowledge Into A Commodity. Here’s What Matters Now

    Gold, Silver and Crude Oil Outlook: Key Levels and Market Movers

    Silver Technical Outlook: VC PMI, Cycle Analysis Signal Potential Bullish Breakout

    Gas prices ease in Southern Colorado ahead of July fourth travel surge

    Gas prices ease in Southern Colorado ahead of July fourth travel surge

    • Silver
    • Gold
    • Oil and Gas
  • Crypto
    • All
    • Bitcoin
    • Ethereum
    • Litecoin
    • Ripple
    • Solana
    • XRP
    Strategy Valuation Drop Threatens Key Bitcoin Funding Engine

    Strategy Valuation Drop Threatens Key Bitcoin Funding Engine

    Ethereum Price Analysis: The Crucial Daily RSI Divergence That Could Save ETH From New Lows

    Ethereum Price Analysis: The Crucial Daily RSI Divergence That Could Save ETH From New Lows

    Crypto Daily Market Report | KuCoin

    Ethereum, Chainlink, and Litecoin Highlighted for Long-Term Investment Potential

    Ripple President Monica Long to Share Vision for XRP at Major Event

    Ripple President Monica Long to Share Vision for XRP at Major Event

    Solana Price Prediction: SOL Eyes $80 Breakout as Trendline Test Puts $90 and $95 Targets Back in Focus

    Solana Price Prediction: SOL Eyes $80 Breakout as Trendline Test Puts $90 and $95 Targets Back in Focus

    Ripple’s MiCA win is not a full license yet

    Ripple’s MiCA win is not a full license yet

    • crypto-markets
    • Bitcoin
    • Ethereum
    • Litecoin
    • Ripple
    • XRP
    • Solana
  • Economic Calendar
  • Real Time Chart
Market News Board
No Result
View All Result
Home Crypto

Ethereum Price Analysis: The Crucial Daily RSI Divergence That Could Save ETH From New Lows

by Market News Board
3 hours ago
in Crypto, Ethereum
A A
Ethereum Price Analysis: The Crucial Daily RSI Divergence That Could Save ETH From New Lows


Ethereum remains under pressure across higher timeframes, but the latest price action is showing early signs that bearish momentum may be losing strength. While the broader trend remains decisively bearish, the recent movements suggest that sellers may be approaching exhaustion after weeks of sustained downside.
Ethereum Price Analysis: The Daily Chart
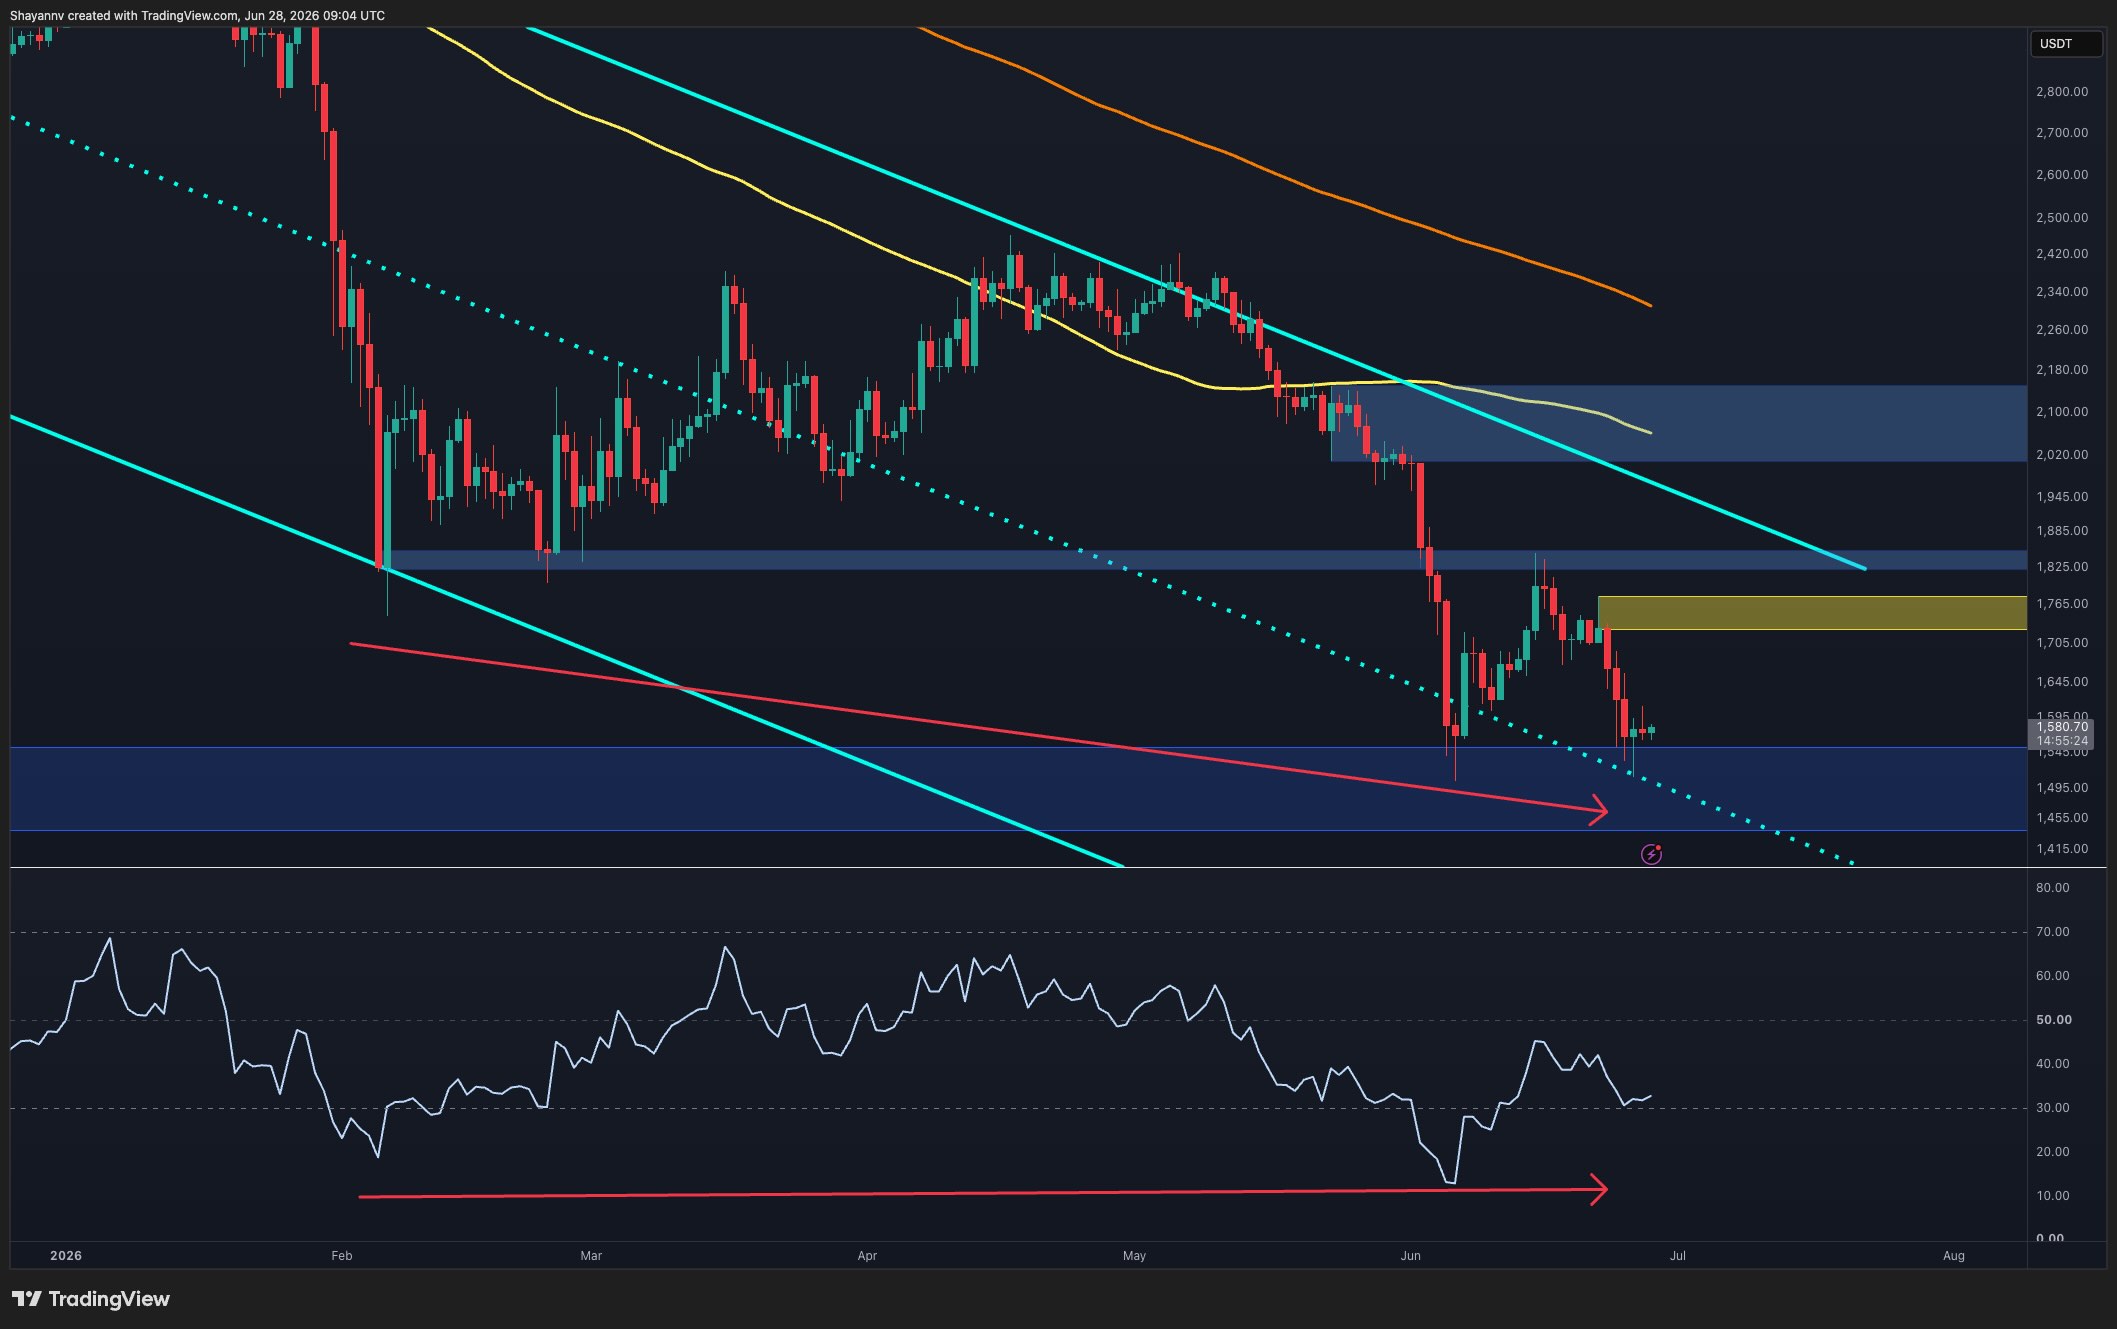
ETH’s recent rejection from the $1.72K-$1.78K supply zone triggered another leg lower, pushing it back into the critical $1.46K-$1.53K demand region. This zone has acted as support multiple times throughout June and continues to attract buyers whenever the price approaches it.
The most notable development on the daily timeframe is the emerging bullish divergence on the RSI. While the asset has continued making lower lows during June, the RSI has been forming higher lows near oversold territory. This divergence suggests that downside momentum is weakening despite ETH remaining near cycle lows.
Although a bullish divergence alone does not guarantee a reversal, it often appears during the latter stages of bearish trends and can serve as an early warning that sellers are losing control. As long as ETH holds above the $1.46K-$1.53K support area, the divergence remains valid, increasing the probability of a relief rally.
However, confirmation would require a break above the nearest resistance zones, particularly the $1.72K-$1.78K supply area. Until then, the broader trend remains bearish despite the improving momentum profile.

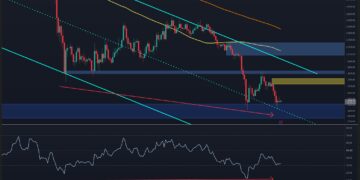
ETH/USDT 4-Hour Chart
On the 4-hour timeframe, Ethereum has spent the past several sessions consolidating above the lower demand zone after the sharp sell-off from resistance.
A descending trendline has capped every recovery attempt since the June 22 rejection. However, the asset is now compressing directly beneath that trendline, while volatility continues to contract. This setup creates the possibility of a short-term breakout if buyers can push through trendline resistance.
A successful breakout would likely target the $1.72K-$1.78K supply zone, which served as the origin of the latest decline. Such a move would align well with the bullish RSI divergence visible on the daily chart and could provide the first meaningful recovery rally in several weeks.
On the downside, the $1.52K area remains the key level to monitor. Losing this support would invalidate the short-term bullish scenario and shift focus back toward deeper downside continuation within the broader downtrend.
For now, Ethereum appears trapped between support and descending resistance, with the next directional move likely determined by whichever side breaks first.

Sentiment Analysis
The liquidation heatmap reveals an interesting shift in liquidity positioning.
While liquidity remains concentrated above the current price, particularly between roughly $1.68K and $1.80K, Ethereum is currently trading beneath these large clusters. Markets often gravitate toward areas with substantial leveraged positioning, making those overhead liquidity pools attractive short-term targets.
This creates a scenario where ETH could stage an upside liquidity sweep before any larger directional move develops. A breakout above the 4-hour descending trendline would increase the probability of price moving into these overhead liquidity pockets, triggering short liquidations and fueling a squeeze toward the $1.7K-$1.8K region.
At the same time, the heatmap also shows notable liquidity beneath the market around the lower support region, meaning both sides of the range remain vulnerable to liquidation-driven volatility.
Combined with the bullish daily RSI divergence and the compression beneath 4-hour trendline resistance, the current setup suggests Ethereum may first attempt an upside liquidity grab before the market determines whether a more sustainable recovery can develop. The reaction around the $1.72K-$1.80K liquidity cluster will likely provide important clues regarding Ethereum’s next major trend.

SPECIAL OFFER (Exclusive)
Binance Free $600 (CryptoPotato Exclusive): Use this link to register a new account and receive $600 exclusive welcome offer on Binance (full details).LIMITED OFFER for CryptoPotato readers at Bybit: Use this link to register and open a $500 FREE position on any coin!Disclaimer: Information found on CryptoPotato is those of writers quoted. It does not represent the opinions of CryptoPotato on whether to buy, sell, or hold any investments. You are advised to conduct your own research before making any investment decisions. Use provided information at your own risk. See Disclaimer for more information.


Source link

RelatedPosts

Strategy Valuation Drop Threatens Key Bitcoin Funding Engine

by Market News Board
June 28, 2026
Strategy Valuation Drop Threatens Key Bitcoin Funding Engine

Bitcoin’s largest corporate buyer, bitcoin treasury company Strategy, saw a valuation metric drop below a key threshold Friday (June 26), Bloomberg reported Friday. The ratio...

Read moreDetails

Ethereum, Chainlink, and Litecoin Highlighted for Long-Term Investment Potential

by Market News Board
June 28, 2026
Crypto Daily Market Report | KuCoin

Ethereum: Smart contracts and proof-of-stake strengthen long-term growth potential.Chainlink: Decentralized oracles connect blockchain networks with reliable real-world data.Litecoin: Fast, low-cost transactions support steady adoption and...

Read moreDetails
rdfhdhhnd rdfhdhhnd rdfhdhhnd

dx

June 2026
M T W T F S S
1234567
891011121314
15161718192021
22232425262728
2930  
     
Market News Board Market Analysis Charts & News

© 2026 Market News Board - Market Analysis,Charts & News by Market News Board.

Navigate Site

  • About
  • Contact
  • Terms and Conditions
  • Privacy Policy
  • Disclaimer

Follow Us

Apple Inc.
$283.78
GBP/USD
$1.32
Amazon.com, Inc.
$232.69
Alphabet Inc.
$334.69
EUR/USD
$1.14
Tesla, Inc.
$379.71
Microsoft Corporation
$372.97
Dow Jones Industrial Average
$51,876.11
USD/JPY
$161.76
Micro Gold Futures,Aug-2026
$4,074.80
Bitcoin USD
$59,214.74
USD/CAD
$1.42
USD/CHF
$0.81
No Result
View All Result
  • Home
  • Market Overview
    • Economy News
    • Cryptocurrency News
    • Stock Market
    • Crude Oil Prices
    • ETFs
    • Indices
  • Forex Market
    • Fed Interest Rate Decision
    • Nonfarm Payroll
    • Currencies
    • Central Banks News
  • Commodities
    • Silver
    • Gold
    • Oil and Gas
  • Crypto
    • crypto-markets
    • Bitcoin
    • Ethereum
    • Litecoin
    • Ripple
    • XRP
    • Solana
  • Economic Calendar
  • Real Time Chart

© 2026 Market News Board - Market Analysis,Charts & News by Market News Board.

This website uses cookies. By continuing to use this website you are giving consent to cookies being used. Visit our Privacy and Cookie Policy.