


Fundamental
Overview
The S&P 500 rallied
into new all-time highs this week following a couple of positive catalysts. The
first one came from Fed’s Bowman who delivered dovish comments and
even suggested that she would support a rate cut in July if inflationary
pressures were to be muted. Since she’s been a hawkish member, it was
meaningful for the market.
The second catalyst, which
gave the green light for the rally, came later in the same day as Iran’s retaliation was seen as just a show much like
the one witnessed in 2020 with Suleimani. The market started to expect the end
of the conflict which was then confirmed by Trump’s post on his social media
platform.
Finally, yesterday’s rally
got attributed to a WSJ report saying that Trump could speed up the nomination
of the new Fed Chair for 2026 which the market expects to be a dove and to
follow the President’s agenda. I’m personally sceptical of this take, but here
we are.
In the big picture, the
path of least resistance remains to the upside as growth expectations continue
to improve. We now have very little risks ahead. The only one I can see is
Trump’s bill failing in the Senate, which would likely just provide a pullback
to buy at better prices.
The trade war shouldn’t be
a risk anymore as the deadline will be extended and it’s now clear to everyone
that we will settle around 10% tariff rate.
Finally, we have the US NFP
and US CPI coming up in the next two weeks and those will be key for the Fed
and market as they will influence interest rates expectations.
The positive drivers
continue to be expansionary fiscal policy and the dovish Fed reaction function.
The main driver of the stock market is growth expectations, so as long as those
remain skewed to the upside, we should keep grinding higher.
S&P 500
Technical Analysis – Daily Timeframe
S&P 500 Daily
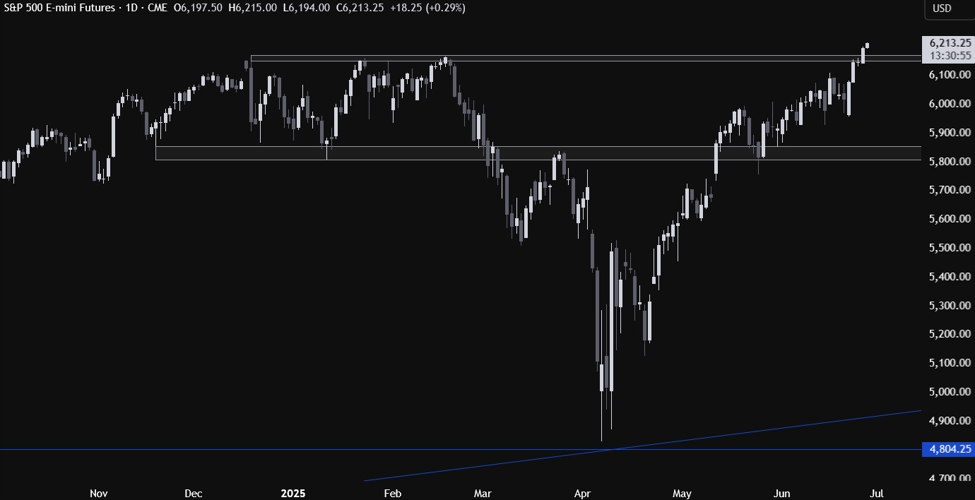
On the daily chart, we can
see that the S&P 500 eventually managed to break into a new all-time high. The
buyers piled in more aggressively on the breakout as the momentum kept going. For
the sellers, there’s not much they can do here other than waiting for a fall
back below the previous all-time high around the 6,150 level before considering
shorts into the 6,000 level next.
S&P 500 Technical
Analysis – 4 hour Timeframe
S&P 500 4 hour
On the 4 hour chart, we can
see that the bullish momentum was so strong that the price broke through a
strong resistance zone where we have also the upper
bound of the rising channel. If we get a pullback into the 6,150 zone, we can
expect the buyers to step back in with a defined risk below the zone to
position for new highs. The sellers, on the other hand, will look for a break
lower to start targeting the 6,000 level next.
S&P 500 Technical
Analysis – 1 hour Timeframe
S&P 500 1 hour
On the 1 hour chart, there’s
not much else we can add here but on a short term basis, if we get a pullback
into the minor upward trendline, the buyers will likely lean on it
to keep pushing into new highs. From a risk to reward perspective, a pullback
into the 6,150-6,160 zone would be better though. Dip-buyers could split their
positions between the trendline and the support zone. The red lines define the average daily range for today.
Upcoming
Catalysts
Today, we conclude the week with the US PCE price index and
the Final University of Michigan Consumer Sentiment report.
ForexLive.com
is evolving into
investingLive.com, a new destination for intelligent market updates and smarter
decision-making for investors and traders alike.


