


- Bitcoin price hovers around $107,000 on Friday, inches shy from its all-time highs.
- Ethereum nears its key resistance at $2,461, a breakout could trigger an upward momentum.
- XRP struggles to hold a break above its 50-day EMA at $2.20, with a rejection suggesting potential short-term weakness.
Bitcoin (BTC) is hovering around $107,000 on Friday, just 4% from its all-time highs. Meanwhile, Ethereum (ETH) and Ripple (XRP) are approaching their major resistance zone, and a breakout here could spark renewed interest and potential gains on the horizon.
Bitcoin inches away from all-time highs
Bitcoin price declined, reaching a daily low of $98,200 on Sunday, but avoided a daily close below the $100,000 psychological level. BTC recovered sharply on Monday and continued its recovery over the next two days, closing above $107,000 on Wednesday and stabilizing the next day. At the time of writing on Friday, it hovers around $107,000.
If BTC continues its ongoing rally, it could extend the rally toward its May 22 all-time high at $111,980. A successful close above this level could extend additional gains to set a new all-time high at $120,000.
The Relative Strength Index (RSI) on the daily chart reads 55, above its neutral level of 50, indicating bullish momentum. The Moving Average Convergence Divergence (MACD) indicator also displayed a bullish crossover on Thursday, providing a buy signal and indicating an upward trend.
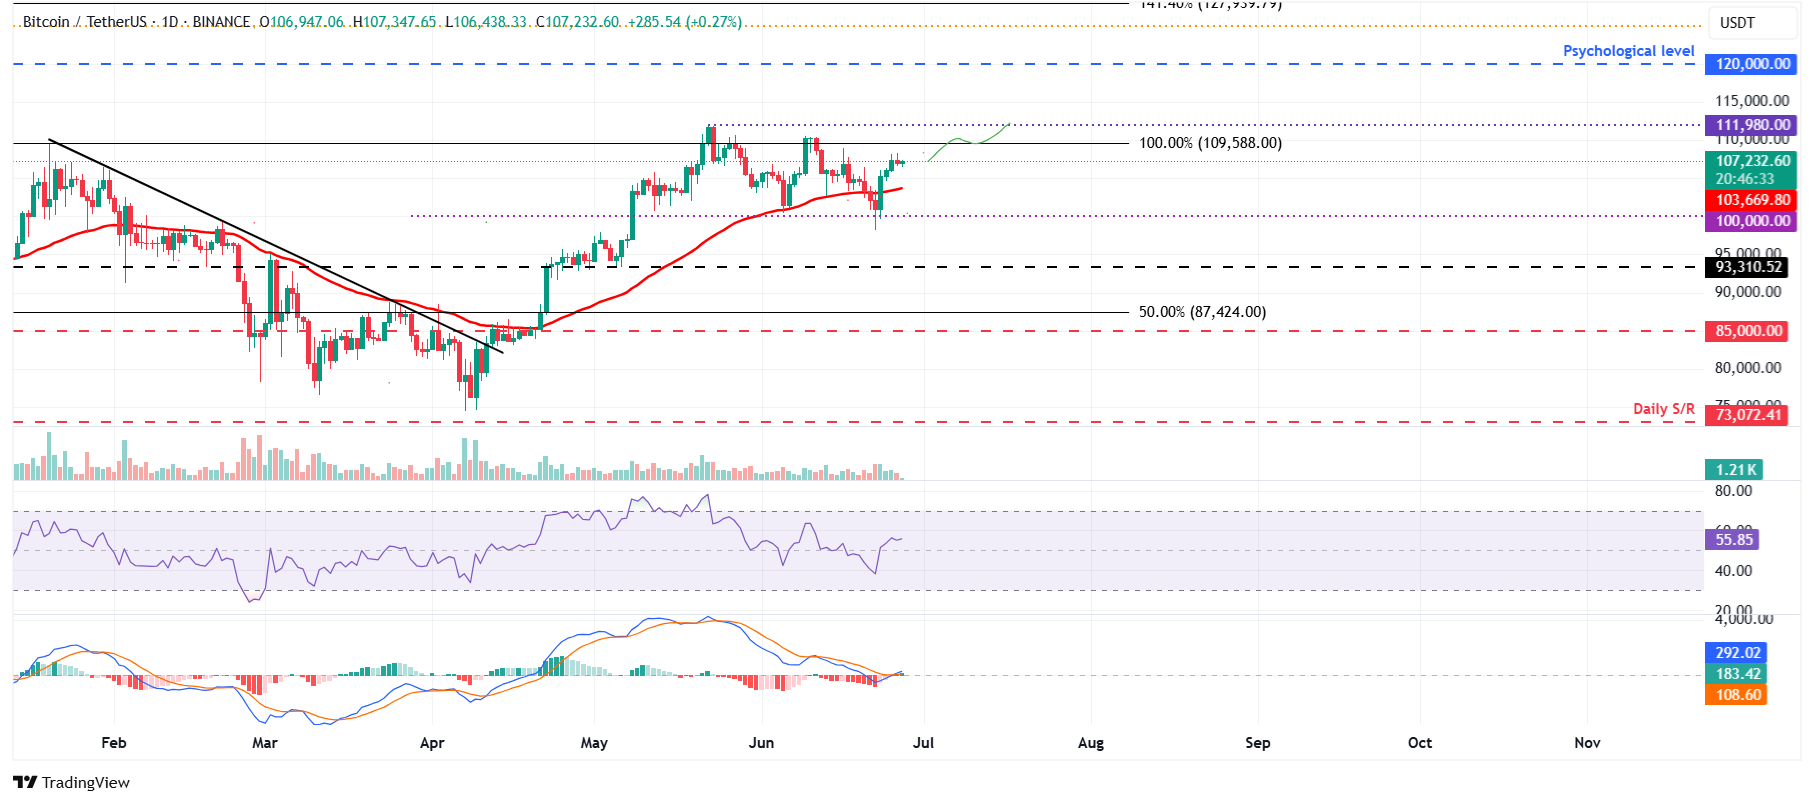
BTC/USDT daily chart
However, if BTC faces a correction, it could extend the decline to find support around its 50-day Exponential Moving Average (EMA) at $103,700.
Ethereum is on the verge of a bullish breakout
Ethereum price has recovered nearly 10% over the last two days, since Monday, and hovered below its key resistance level at $2,461 until Thursday. At the time of writing on Friday, it continues to hover below this key resistance level.
If ETH breaks and closes above the $2,461 daily resistance, it could extend the rally toward its next daily resistance level at $2,724.
The RSI on the daily chart is approaching its neutral level of 50, indicating a fading bearish momentum. For the bullish momentum to be sustained, the RSI must move above its neutral level. The MACD is hinting at a bullish crossover (the MACD line is close to crossing above the signal line), which, if completed, would give a buy signal.
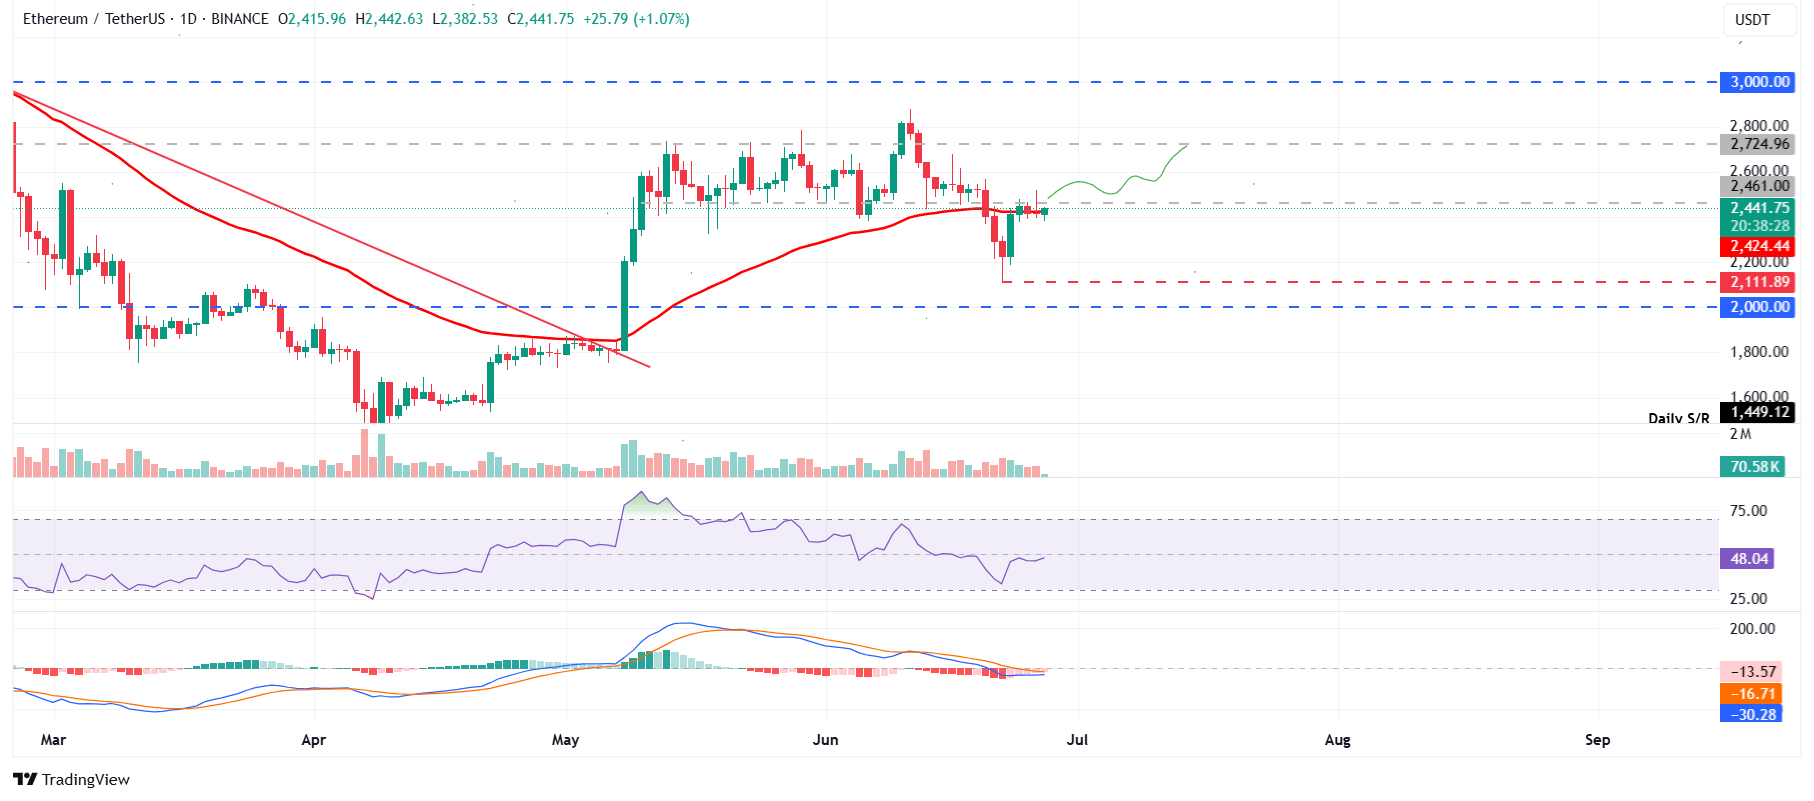
ETH/USDT daily chart
On the other hand, if ETH faces a rejection from the $2,461 level, it could extend the decline to retest its Sunday low of $2,111.
XRP could rally if it closes above its 50-day EMA
Ripple price found support around its daily level at $1.96 on Monday and recovered nearly 9%. However, it faced rejection from its 50-day EMA and declined 3.68% until Thursday. At the time of writing on Friday, it hovers at around $2.10.
If XRP breaks and closes above its 50-day EMA at $2.21 on a daily basis, it could extend the rally toward its May 23 high of $2.47.
The RSI on the daily chart read 44 below its neutral level of 50, indicating bearish momentum.
For the bullish momentum to be sustained, the RSI should continue to move above its neutral level. The MACD indicator also coils against itself, indicating indecisiveness among traders.
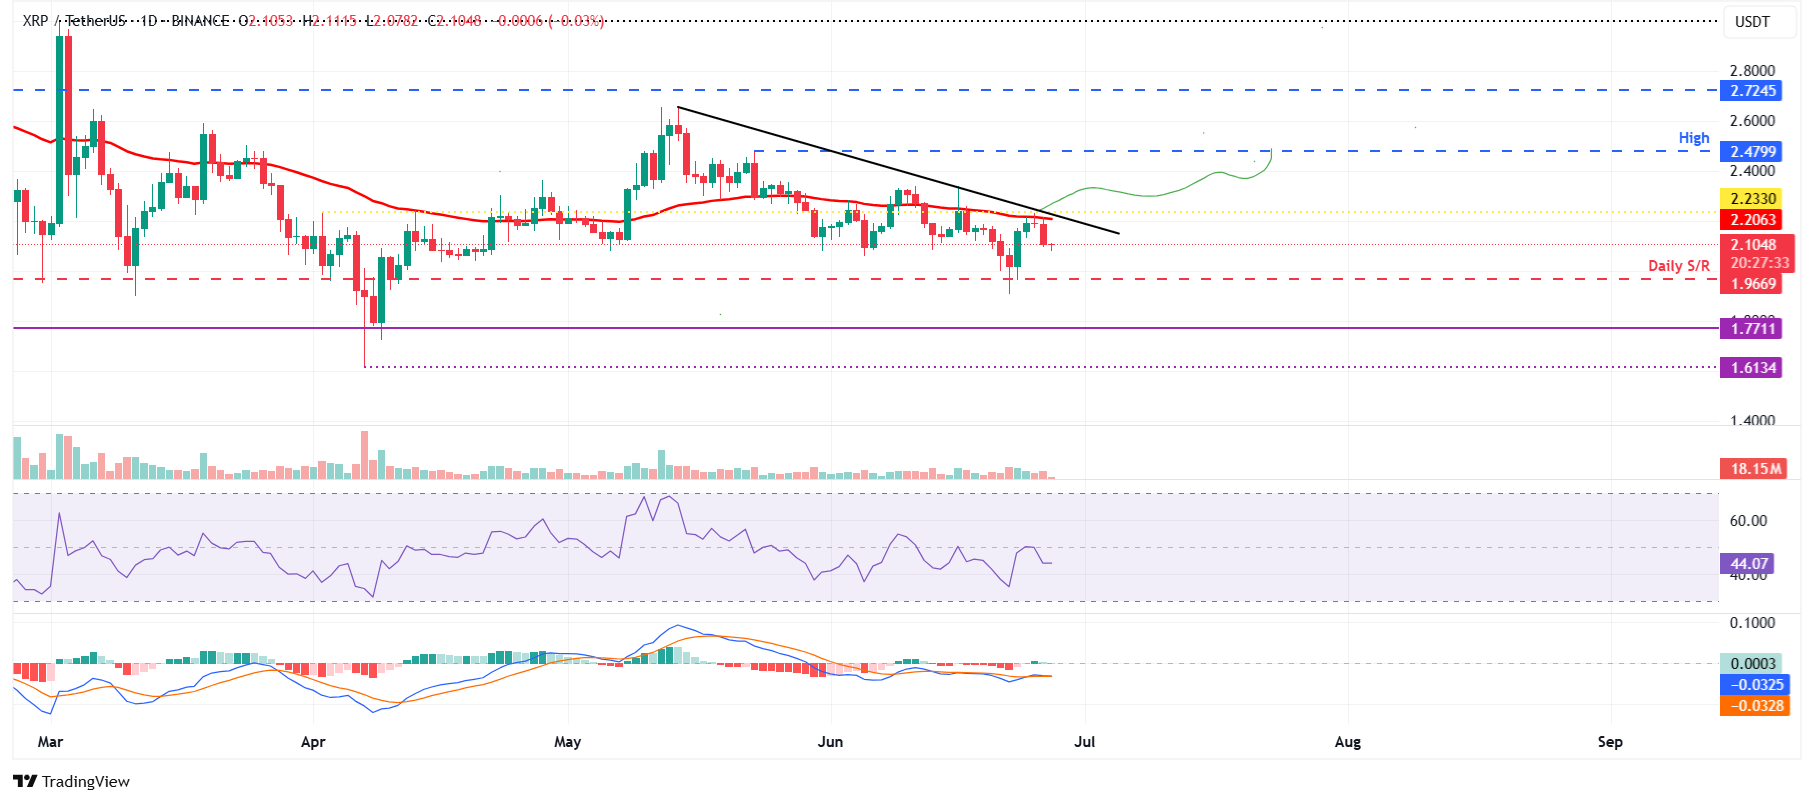
XRP/USDT daily chart
Conversely, if XRP continues its decline, it could extend the correction to retest its daily support at $1.96.
Bitcoin, altcoins, stablecoins FAQs
Bitcoin is the largest cryptocurrency by market capitalization, a virtual currency designed to serve as money. This form of payment cannot be controlled by any one person, group, or entity, which eliminates the need for third-party participation during financial transactions.
Altcoins are any cryptocurrency apart from Bitcoin, but some also regard Ethereum as a non-altcoin because it is from these two cryptocurrencies that forking happens. If this is true, then Litecoin is the first altcoin, forked from the Bitcoin protocol and, therefore, an “improved” version of it.
Stablecoins are cryptocurrencies designed to have a stable price, with their value backed by a reserve of the asset it represents. To achieve this, the value of any one stablecoin is pegged to a commodity or financial instrument, such as the US Dollar (USD), with its supply regulated by an algorithm or demand. The main goal of stablecoins is to provide an on/off-ramp for investors willing to trade and invest in cryptocurrencies. Stablecoins also allow investors to store value since cryptocurrencies, in general, are subject to volatility.
Bitcoin dominance is the ratio of Bitcoin’s market capitalization to the total market capitalization of all cryptocurrencies combined. It provides a clear picture of Bitcoin’s interest among investors. A high BTC dominance typically happens before and during a bull run, in which investors resort to investing in relatively stable and high market capitalization cryptocurrency like Bitcoin. A drop in BTC dominance usually means that investors are moving their capital and/or profits to altcoins in a quest for higher returns, which usually triggers an explosion of altcoin rallies.


