


The Bank of Japan (BOJ) releases a “Summary of Opinions” after each monetary policy meeting. It serves as a record of the discussion and views of the Policy Board members on various economic and financial issues.
Key points about the meeting Summary:
- The summary includes the views of the Policy Board members on economic conditions, both domestically and globally. This includes assessments of economic growth, inflation, and employment trends, among other indicators.
- The summary also outlines the Policy Board members’ views on the effectiveness of the BOJ’s current monetary policy measures, including interest rate policy, asset purchases, and yield curve control. Members may discuss the pros and cons of these policies and their potential impact on the economy.
- The summary includes discussions on the outlook for monetary policy and the potential risks to the economy. Board members may express their views on the appropriate timing and direction of future policy changes, as well as the potential impact of external factors such as global economic conditions.
- The summary also includes any dissenting views among the Policy Board members. If a member disagrees with the majority view on a particular issue, they may express their own opinion and rationale.
Today’s Summary is from the June 16-17 meeting. From that meeting:
and the news confernce that followed:
—
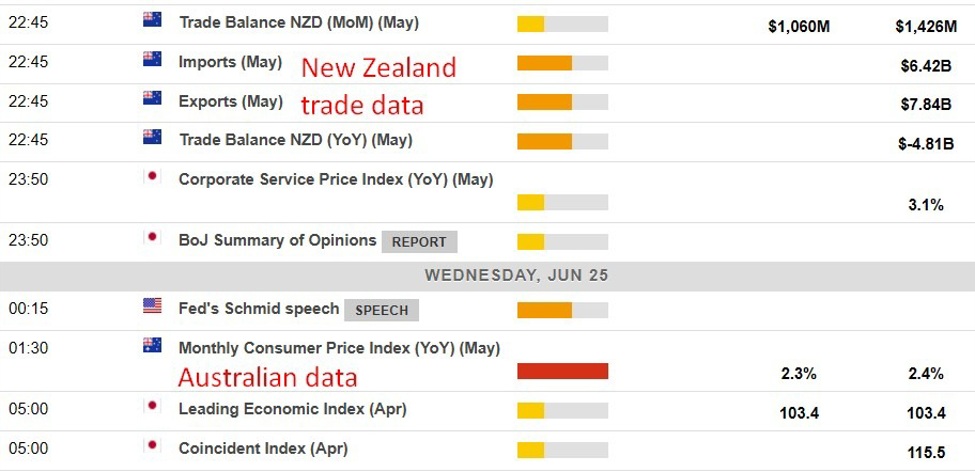
Also of note is the monthly inflation data from Australia, for May 2025.
I’ve posted this info before, but ICYMI:
- In Australia, the Consumer Price Index (CPI) measures the average change over time in the prices paid by households for a fixed basket of goods and services. Traditionally, the Australian Bureau of Statistics (ABS) has published CPI data quarterly, providing comprehensive insights into inflation trends.
- To offer more timely information, the ABS introduced a Monthly CPI Indicator in October 2022. This monthly indicator includes updated prices for around two-thirds of the items in the CPI basket, offering a more frequent snapshot of inflation. However, it is less detailed than the quarterly CPI, as it covers fewer items and provides data only at the national level. The monthly indicator includes aggregate headline CPI, trimmed mean, each of the 11 CPI groups (e.g., clothing & footwear, health), and some selected expenditure classes (e.g., automotive fuel, new dwelling costs, rents, domestic and international travel, and some food categories).
- While the monthly CPI indicator follows similar trends to the quarterly CPI, they are not identical. This is because, when prices are collected less frequently than monthly, the monthly CPI indicator assigns price changes to the month they are collected, whereas in the quarterly CPI series, price changes are allocated across the entire quarter. Therefore, the average of the index in the three months for the monthly CPI indicator will not equal the index of the quarterly CPI.
- In summary, the monthly CPI indicator provides more frequent updates on inflation trends, while the quarterly CPI offers a more comprehensive and detailed analysis.
The Monthly CPI came in at 2.4% y/y for the previous month, April:
- +0.8% m/m
- trimmed mean was 2.8% y/y
Estimates are for 2.3% y/y headline in May’s data due today. May is the second month of Q2. The second month provides updates on some of the quarterly survey services.
- This snapshot from the ForexLive economic data calendar, access it here.
- The times in the left-most column are GMT.
- The numbers in the right-most column are the ‘prior’ (previous month/quarter as the case may be) result. The number in the column next to that, where there is a number, is the consensus median expected.
- I’ve noted data for New Zealand and Australia with text as the similarity of the little flags can sometimes be confusing.
Later this year,
ForexLive.com
is evolving into
investingLive.com, a new destination for intelligent market updates and smarter
decision-making for investors and traders alike.
ForexLive.com
is evolving into
investingLive.com, a new destination for intelligent market updates and smarter
decision-making for investors and traders alike.


