


Fundamental
Overview
Gold recently got a boost
from safe haven flows triggered by the Israel and Iran attacks. Those flows
eventually reversed as the market started to look through the conflict given
that key macro factors like energy supply didn’t get impaired.
Yesterday, tensions rose as
the probabilities for direct US involvement increased and traders feared an
attack in the Asian session. That didn’t happen but it’s said that the next
24/48 hours will be key. Those tensions triggered some risk-off flows across
the board, but interestingly gold didn’t react that much.
In the bigger picture
though, gold remains in an uptrend as real yields will likely continue to fall
amid Fed easing and just a repricing in rate cuts expectations could trigger
corrections in the short term.
Gold
Technical Analysis – Daily Timeframe
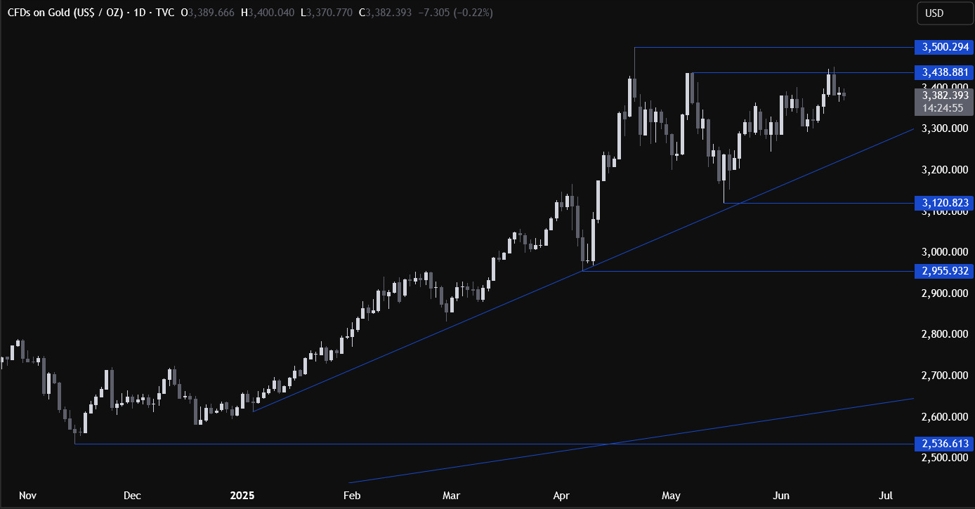
Gold Daily
On the daily chart, we can
see that gold eventually rejected the key 3438 level as the sellers piled in to
target a pullback into the major upward trendline. From a risk management
perspective, the buyers will have a much better risk to reward setup around the
major trendline to position for a rally into a new all-time high. The sellers,
on the other hand, will look for a break lower to increase the bearish bets
into the 3120 level next.
Gold Technical Analysis
– 4 hour Timeframe
Gold 4 hour
On the 4 hour chart, we can
see that we have a minor upward trendline defining the bullish momentum on this
timeframe. We can expect the buyers to lean on the trendline with a defined
risk below it to position for a rally into new highs. The sellers, on the other
hand, will look for a break lower to increase the bearish bets into the major
trendline next.
Gold Technical Analysis
– 1 hour Timeframe
Gold 1 hour
On the 1 hour chart, we can
see that bearish momentum is waning as we approach the trendline. This is
generally a signal that we either get a bounce or a breakout. The buyers will
look for a bounce around the trendline and will likely increase the bullish
bets on a break above the 3405 level. The sellers, on the other hand, will look
for a break below the trendline to pile in for a drop into the next major trendline.
The red lines define the average daily range for today.
Upcoming
Catalysts
Tomorrow, we have the US Jobless Claims and the FOMC Policy
Decision.
ForexLive.com
is evolving into
investingLive.com, a new destination for intelligent market updates and smarter
decision-making for investors and traders alike.


