


- Bitcoin price is breaking above its consolidation level at $95,000 on Thursday, following a mild pullback the previous day.
- US GDP contracted by 0.3% in Q1, missing the expected 0.4% expansion and increasing fears of stagflation.
- CryptoQuant data indicates that the Bitcoin supply in profit is approaching a historic euphoria threshold.
Bitcoin (BTC) price is breaking above its key resistance level, trading above $96,000 at the time of writing on Thursday, following a mild pullback the previous day. The decline came as US GDP data showed a contraction of 0.3% in Q1, spurring recession fears, but BTC’s price fall proved to be short-lived.
Bitcoin recovers after mild decline following US GDP data release
Bitcoin price rebounds to reclaim the $96,000 level, recovering from a brief pullback on Tuesday. This mild correction in Bitcoin’s price was primarily caused by the US GDP data released on Tuesday, which showed an unexpected contraction of 0.3% annualized pace, missing the expected 0.4% growth, indicating stronger chances of entering a stage of stagflation – when the economy is characterized by stagnant growth and high inflation.
The Kobessi Letter report explains that the unexpected GDP contraction (the first since early 2022) came alongside inflation data exceeding forecasts, as shown by the PCE Price Index, also at 3.7% versus the expected 3.1%. Other data seem to be pointing to a deteriorating economic outlook, such as Oil prices dropping below $60 and US consumer confidence falling sharply to 86, the lowest level since May 2020.
Stagflation fears will likely drive a risk-off sentiment in the market, which does not bode well for risky assets such as Bitcoin. Moreover, high inflation reduces retail investor participation, and the US Federal Reserve’s (Fed) reluctance to cut rates immediately adds to the headwinds.
The Fed’s worst nightmare just got worse:
New data showed that US GDP CONTRATCTED by -0.3% in Q1 2025, while +0.3% growth was expected.
To make things worse, the GDP Price Index surged to +3.7%, its highest since August 2023.
What does Powell do now?
(a thread) pic.twitter.com/8ZNeRp4IQv
— The Kobeissi Letter (@KobeissiLetter) April 30, 2025
Institutional demand declined slightly on Wednesday after Bitcoin’s price woes. According to the data from SoSoValue shown below, US spot Bitcoin ETFs recorded a mild outflow of $56.23 million on Tuesday, breaking a continuous inflow streak since April 17. However, these outflows are lower than those seen during February, which caused BTC prices to fall sharply. Traders should be cautious if the outflow levels match those of February as this could weigh on BTC price.
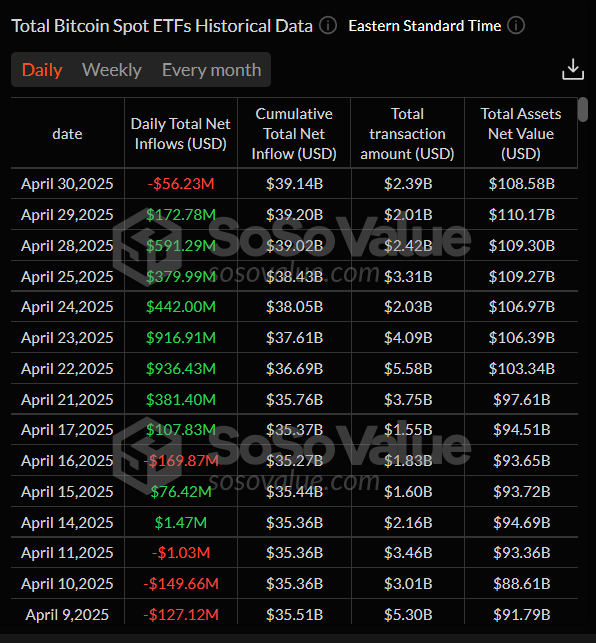
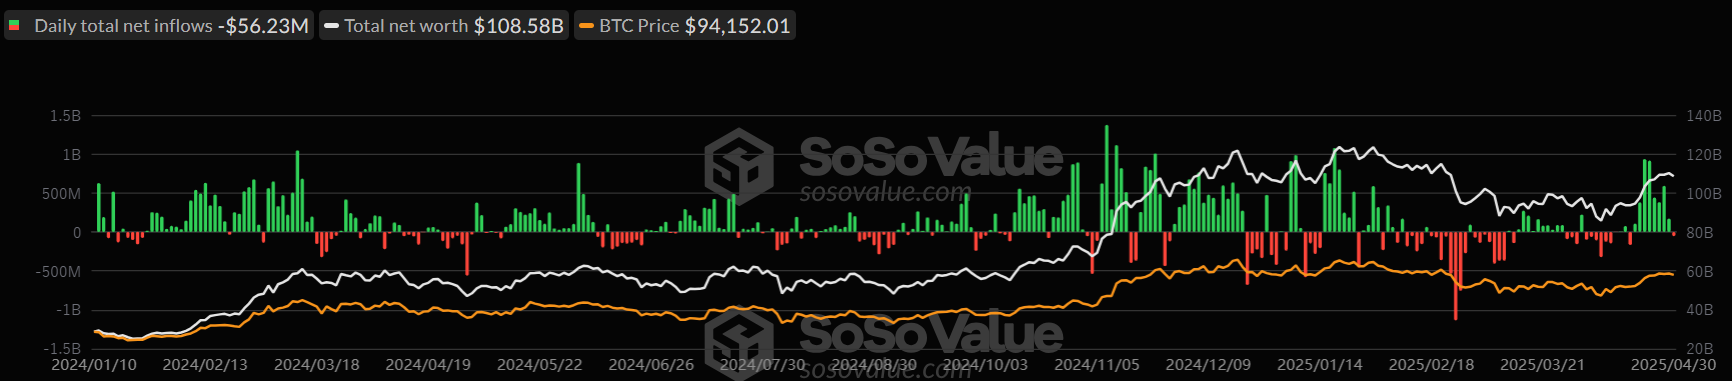
Total Bitcoin Spot ETFs daily chart. Source: SoSoValue
Some signs of optimism
CryptoQuant data shows that the Bitcoin supply in profit is approaching a historic euphoria threshold. Bitcoin Supply in profit refers to the percentage of BTC’s total supply that holders currently hold are in profit. A large portion of the supply in profit is generally seen as a positive sign, suggesting a strong bullish outlook and confidence among investors.
Currently, the metric stands at above 85.8%, approaching its key level of 90%. Historically, when the supply in profit surpassed the 90% threshold, it consistently triggered euphoric phases. However, these euphoric phases can be short-lived and are often followed by short- to medium-term corrections.
-1746098083226.webp)
Bitcoin percentage supply in profit chart. Source: CryptoQuant
Bitcoin Price Forecast: BTC traders await a decisive breakout
Bitcoin price broke above its 200-day Exponential Moving Average (EMA) at $85,000 early last week, rallying 11.14% through Friday. However, BTC failed to close above its March high of $95,000 and hovered around this level during five days. At the time of writing on Thursday, it breaks above this level, trading above $96,000.
If BTC closes above $95,000 on a daily basis, it could extend the rally to retest its next daily resistance at $97,000. A successful close above this level could extend additional gains to retest its psychological resistance at $100,000.
The Relative Strength Index (RSI) on the daily chart holds at 68, suggesting bullish momentum is well alive. However, traders should be cautious as the chances of a pullback are high as it approaches its overbought level at 70. Another possibility is that the RSI remains above the overbought levels and continues its price rally.
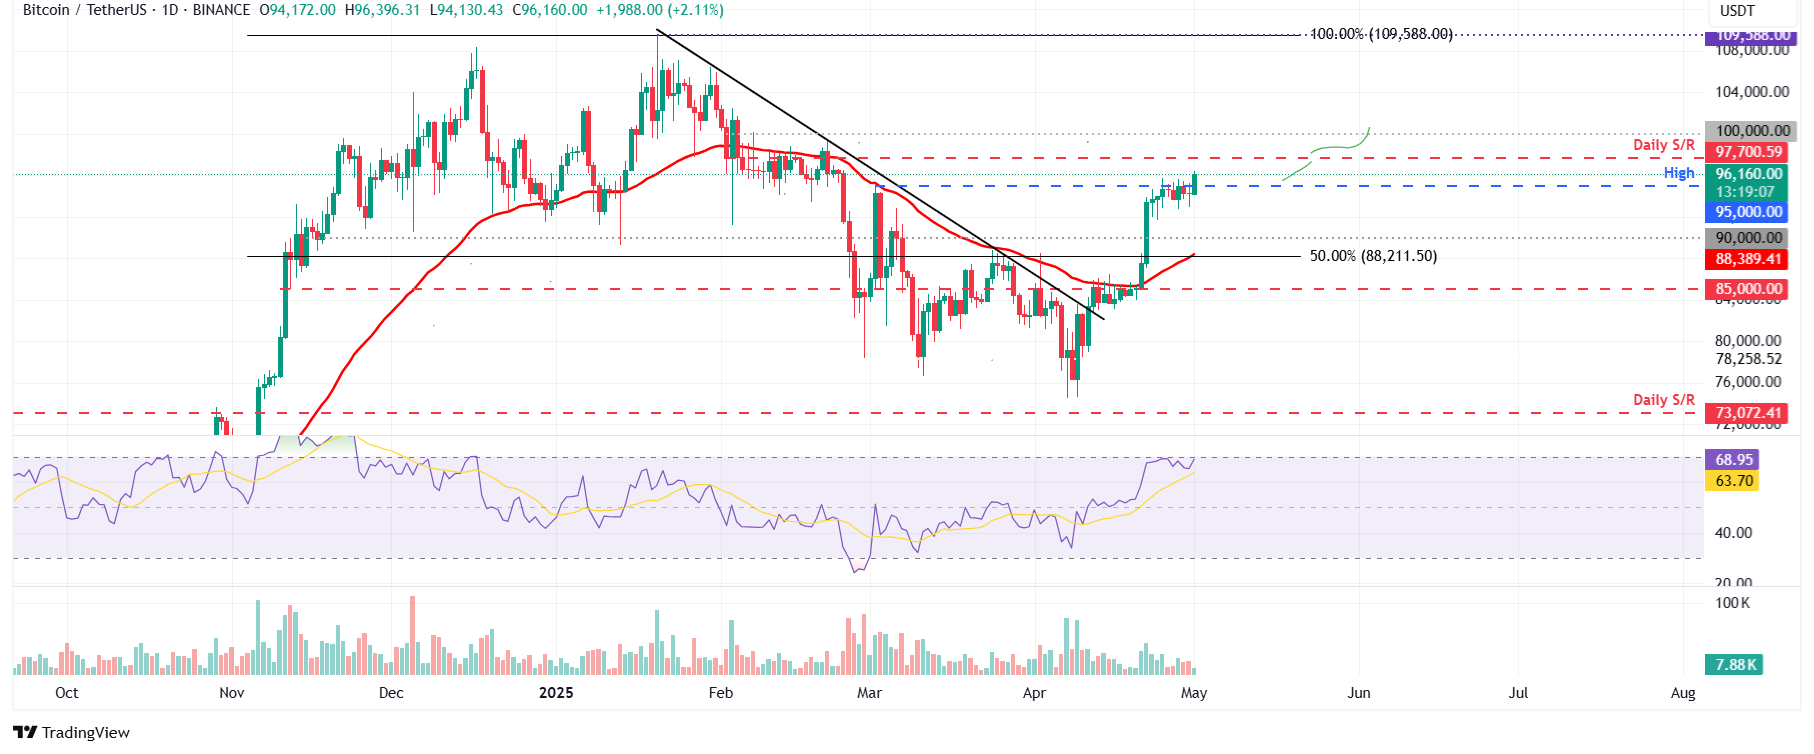
BTC/USDT daily chart
However, if BTC fails to close above the $95,000 resistance level and faces a pullback, it could extend the decline to find support around the $90,000 psychological level.
Bitcoin, altcoins, stablecoins FAQs
Bitcoin is the largest cryptocurrency by market capitalization, a virtual currency designed to serve as money. This form of payment cannot be controlled by any one person, group, or entity, which eliminates the need for third-party participation during financial transactions.
Altcoins are any cryptocurrency apart from Bitcoin, but some also regard Ethereum as a non-altcoin because it is from these two cryptocurrencies that forking happens. If this is true, then Litecoin is the first altcoin, forked from the Bitcoin protocol and, therefore, an “improved” version of it.
Stablecoins are cryptocurrencies designed to have a stable price, with their value backed by a reserve of the asset it represents. To achieve this, the value of any one stablecoin is pegged to a commodity or financial instrument, such as the US Dollar (USD), with its supply regulated by an algorithm or demand. The main goal of stablecoins is to provide an on/off-ramp for investors willing to trade and invest in cryptocurrencies. Stablecoins also allow investors to store value since cryptocurrencies, in general, are subject to volatility.
Bitcoin dominance is the ratio of Bitcoin’s market capitalization to the total market capitalization of all cryptocurrencies combined. It provides a clear picture of Bitcoin’s interest among investors. A high BTC dominance typically happens before and during a bull run, in which investors resort to investing in relatively stable and high market capitalization cryptocurrency like Bitcoin. A drop in BTC dominance usually means that investors are moving their capital and/or profits to altcoins in a quest for higher returns, which usually triggers an explosion of altcoin rallies.


