








Sunday, October 25, 2026
No Result
View All Result
  • Home
  • Market Overview
    • All
    • Crude Oil Prices
    • Cryptocurrency News
    • Economy News
    • ETFs
    • Foreign Exchange News
    • Indices
    • Stock Market

    UN Food Security Report Finds $540BN in Farm Subsidies Locked Into Commodities That Crowd Out Plant Foods – vegconomist

    AEGIS Hedging to Be Acquired by Private Equity at Goldman Sachs Alternatives

    Glencore plans large LME lead withdrawals after stocks surge, sources say

    AI Turns Competence into a Commodity: Evidence from 2.26 Million Freelance Contracts

    JPMAM adds commodities to lagging multi-asset strats

    New Houthi maritime strikes keep European gas futures pinned near multi-month peak

    • Crude Oil Prices
    • Cryptocurrency News
    • Economy News
    • ETFs
    • Indices
    • Stock Market
    • Foreign Exchange News
    • Commodities News
  • Forex Market
    • All
    • Central Banks News
    • Currencies
    • Interest Rate
    • Nonfarm Payroll

    US Interest Rate Forecast: Oil Rally Fuels December Fed Hike Risks

    USD/JPY Forecast: Is Rising Japanese Inflation Supporting the Yen?

    EUR/USD Weekly Outlook – ActionForex

    EUR/USD Price Prediction: Analyst Warns of More Downside Before a Rebound

    EUR/USD Weekly Forecast: Fed, ECB and 1.1000 in focus

    EUR/USD failed to break through the French barrier

    Gold Technical Outlook: XAU/USD Breakdown Threatens Deeper Selloff

    EUR/USD Bounce Hits a Wall of Fed Hawks and French Finances

    Euro: Range trading consolidation persists against US Dollar

    • Central Banks News
    • Currencies
    • Interest Rate
    • Nonfarm Payroll
  • Forex Analysis
        • EUR/USD
        • GBP/USD
        • AUDUSD
        • USD/JPY
        • USDCAD
        • NZD/USD
        • USD/CHF
  • Crypto
        • Bitcoin
        • Litecoin
        • BNB
        • XRP
        • Ethereum
        • Solana
  • Commodities
        • XAUUSD
        • XAGUSD
        • Oil & Gas
  • Charts
  • Economic Calendar
MarketNewsBoard
No Result
View All Result
Home Forex Market
4 months ago

Is the strong non-farm employment due to the World Cup?

[Editor’s Note] After the release of the nonfarm payroll data and the huge volatility in the market, many investors have raised similar questions, mainly focusing on two points. First, whether recent employment is related to the sporting event; second, why the employment data have significantly exceeded expectations. To answer this, we compared the initial jobless claims data in recent host states versus non-host states, and looked back at employment changes after large-scale sporting events historically held in the US.The conclusion is that current evidence is insufficient to prove that sporting events are the main reason behind this month’s surge in leisure and hospitality employment.We believe that,the signs of US employment recovery have become clearer since the beginning of the year, driven by the lagged effect of last year’s precautionary rate cuts and the recent revival of the global manufacturing cycle. Simply attributing recent strong job numbers to a single sporting event may overlook more important cyclical signals worth focusing on.

1. Question 1: Is the strength in this month’s nonfarm payrolls driven by the sporting event?

In this month’s nonfarm employment, leisure and hospitality jobs grew by 70,000, significantly outpacing March and April. Some opinions argue that the robust hiring in leisure and hospitality reflects advanced hiring practices by employers. We take a cautious view:The current evidence is insufficient to confirm it as the primary driver for the surge in leisure and hospitality employment this month. There are three main reasons for this:

Reason 1: According to initial jobless claims, there’s no significant divergence between host states and non-host states

Although May’s regional employment data haven’t been released yet, the initial jobless claims data are available up to the week of May 23, covering the reference period of May’s nonfarm payrolls. Thus, by comparing initial claims, we can assess the impact of the event on regional employment conditions.

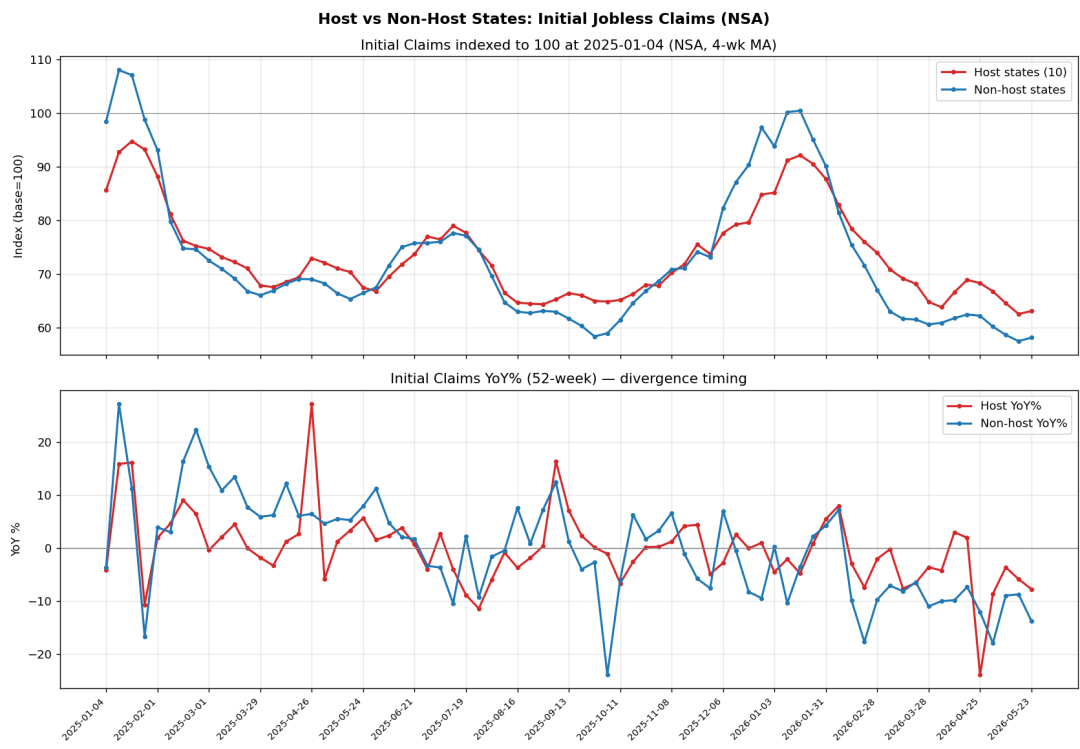
We grouped the 10 states (California, Texas, Georgia, Florida, New York, New Jersey, Pennsylvania, Massachusetts, Missouri, Washington) with 11 host cities as “host states”, while all others are “non-host states”. Figure 1 compares initial jobless claims (unadjusted) between the two groups from April to May. Since the beginning of the year,initial claims in both groups have fallen year-over-year, with similar trends. There is no indication—either in absolute numbers or in year-over-year growth rates—of a tighter labor market in the host states.In fact, the year-over-year drop in initial claims in non-host states since April is even slightly greater.

Figure 1: Comparison of Initial Jobless Claims and Year-over-Year Changes in Host States vs Non-Host States ‘ initial jobless claims and annual changes
Is the strong non-farm employment due to the World Cup? image 0

 Data Source: Fred, GMF Research

Reason 2: Historically, US major sporting events have not caused significant disruption in employment.

The US has hosted many major sporting events in history, such as the 1984 Los Angeles Olympics, the 1994 World Cup, the 1996 Atlanta Olympics, and the 2002 Salt Lake City Winter Olympics.

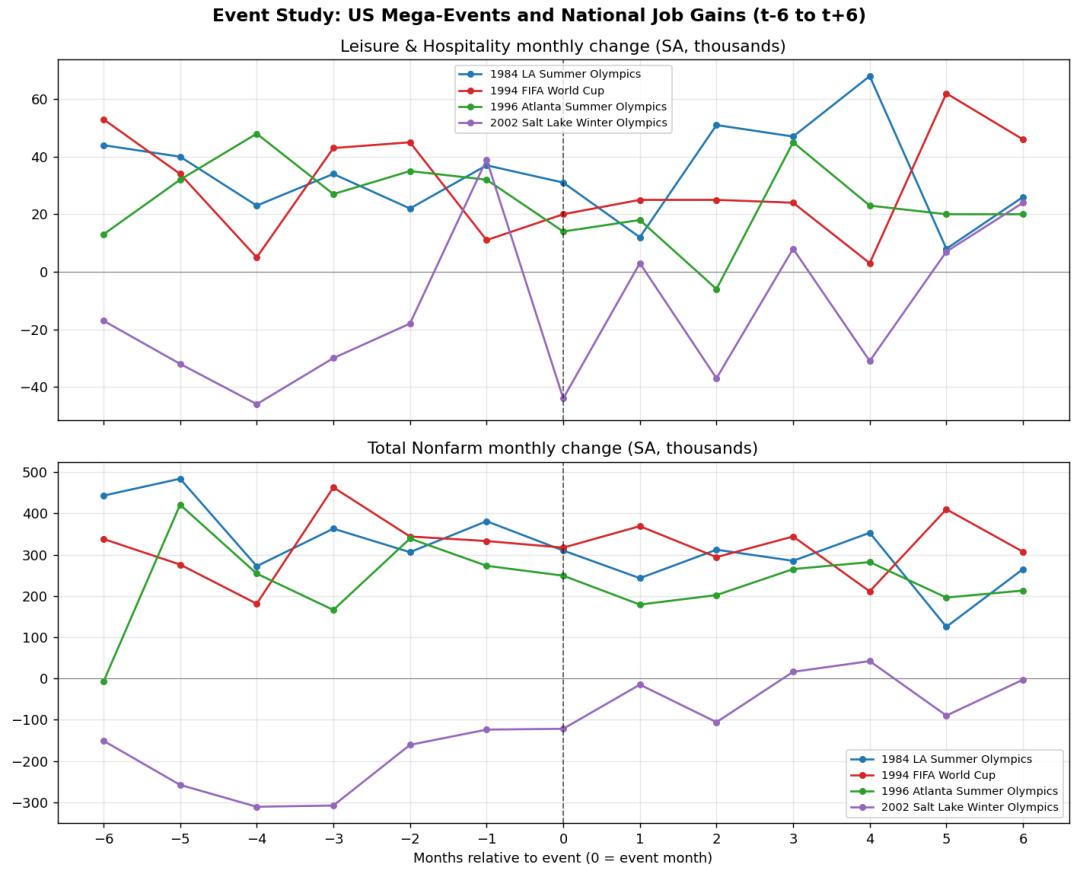
Using the holding month as the baseline (t=0), we examined monthly additions in leisure and hospitality versus total employment in nonfarm payrolls, six months before and after the event (t-6 to t+6).Figure 2 shows that, nationwide, there was no clear employment surge before or after the event. Nor was there any “leisure and hospitality hiring surge, followed by retreat” pattern.The increase in leisure and hospitality jobs during the event month was mostly in line with (or slightly below) pre-event baselines on all four occasions. Total nonfarm payroll did not systematically jump either. Logically, even if there was a leap at the host-state level,its share of total national employment is relatively small and is often outweighed by fluctuations in the national total.

Figure 2: US Nonfarm Payrolls and Leisure & Hospitality Employment Before and After Four Major Historical Sporting Events
Is the strong non-farm employment due to the World Cup? image 1

 Data Source: BLS, GMF Research

Reason 3: Neither the Beige Book nor enterprise comments in the Services PMI mention event-related impacts.

In qualitative evidence, the latest US Fed Beige Book (including the Atlanta Fed district with two host cities Atlanta and Miami) clearly stated that,local tourism demand weakened due to higher energy and travel costs. The main narrative revolves around rising oil prices due to Middle East tensions, tariffs, and AI/automation boosting productivity—there is no mention at all of sporting events.ISM Services PMI survey comments only mentioned “spring weather led to more activities,” and “low consumer confidence and high mortgage rates create pressure,again, no mention of events.”

Question 2: Why did employment numbers far exceed expectations?

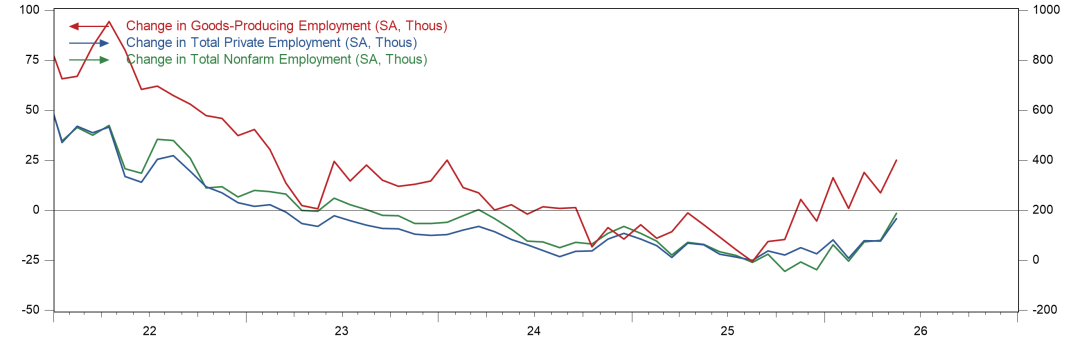
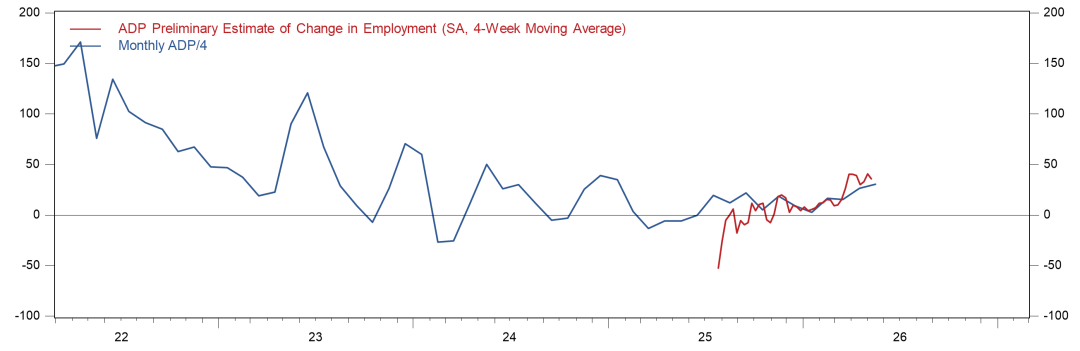
In fact, signs of recovery in the US job market have gradually become clearer since the start of the year. One could say that May’s nonfarm payrolls simply confirmed this trend.Figure 3 shows the three-month moving average of net job gains for total nonfarm payrolls, private sector, and industrial sector employment (left axis). Even excluding May’s data, the trend has already reversed its negative trajectory from the second half of 2025 and started to rebound since the start of the year. Weekly ADP small business job data also has rebounded since the start of the year and does not depend on May’s single reading.

Figure 3:New Jobs ,New Private Sector Jobs and Industrial Sector New Jobs (3mma)
Is the strong non-farm employment due to the World Cup? image 2

 Data Source: Haver, GMF Research

Figure 4: Weekly ADP Small Business Net Job Increases (Weekly Value vs Monthly Value/4)
Is the strong non-farm employment due to the World Cup? image 3

 Data Source: Haver, GMF Research

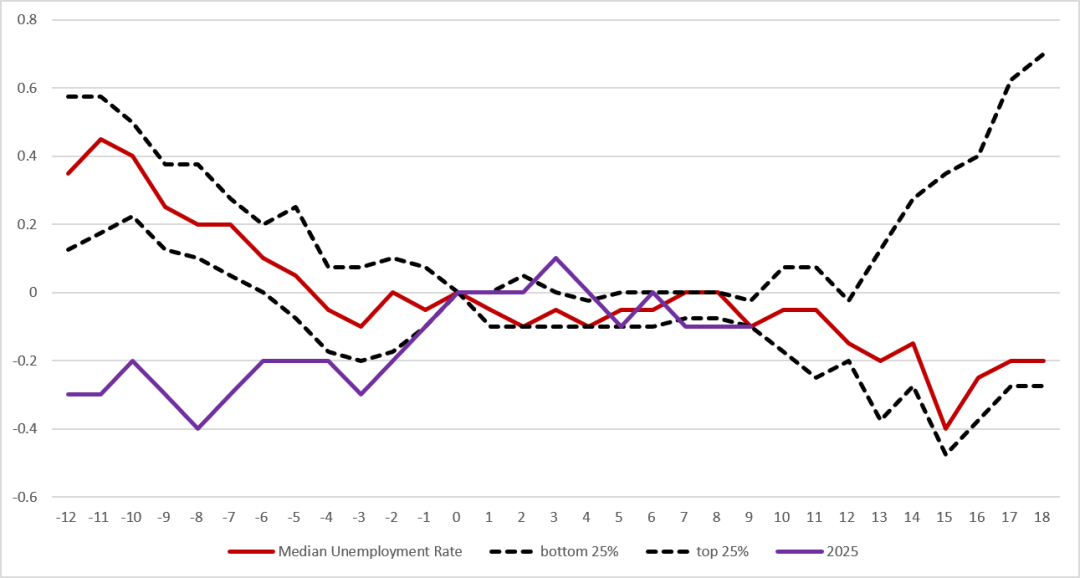
Since the beginning of the year, the marginal improvement in the labor market aligns with the historical pattern following soft-landing rate cuts.Historically, after a soft-landing rate cut, the unemployment rate usually shifts from “continuous decline” to “stable sideways” shortly after cuts begin, with further declines three quarters later. In the current cycle (since September 2025), the unemployment rate has behaved consistently with this pattern (spiking, then falling, then stabilizing). Based on this, the jobless rate is expected to continue falling toward mid-year and approach 4% by year-end.

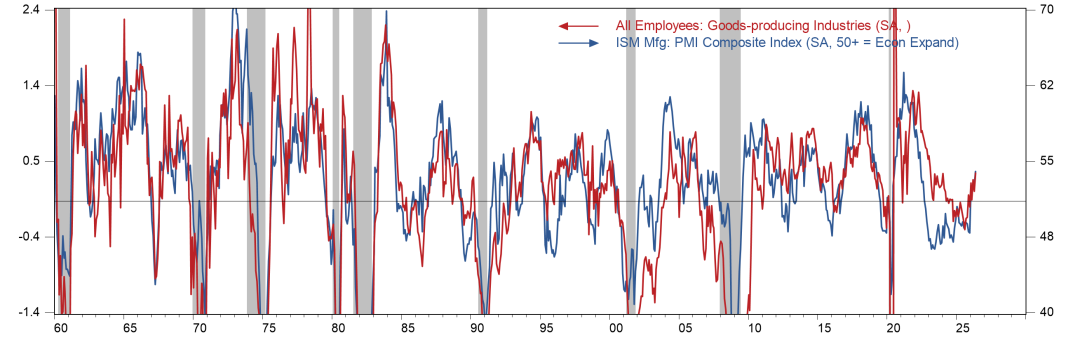
Notably, the rebound in industrial sector employment deserves more attention than service sector employment—and is more informative. In the past three months, the US industrial sector (goods-producing industries) has averaged 75,000 new jobs per month, compared to -77,000 in mid-2023. Historically, manufacturing employment is more cyclical and more highly correlated with the PMI cycle (see Figure 6). Since early this year, global PMIs have turned upward for multiple reasons, US ISM PMI has risen to 54, driving a revival in industrial sector job data.

Figure 5: US Unemployment Rate 2 Years Before and After Historical Soft-Landing Rate Cuts

(Purple: this cycle; Red: historical median)
Is the strong non-farm employment due to the World Cup? image 4

Data Source: GMF Research

Figure 6: High Correlation Between Industrial Sector Employment and US ISM PMI
Is the strong non-farm employment due to the World Cup? image 5

Data Source: Haver, GMF Research

In summary, the recent improvement in US employment data is a natural outcome of prior monetary policy easing and the global manufacturing recovery cycle.We believe that to attribute this entirely to a temporary factor such as a sporting event is to “miss the forest for the trees,” potentially underestimating the persistence of the labor market recovery. In short, tying this month’s strong employment purely to a single event is not supported by data and could obscure more important cyclical signals.

Of course, the equity market’s reaction to Friday’s jobs data remains “excessive.”Theoretically, a 10bp rise in the 10y US Treasury real yield corresponds to roughly a 0.7% drop in the S&P 500. On Friday, the 10y yield rose only 8bp, while the S&P 500 fell more than 2.6%, far beyond historical norms.This shows that the fragility of positions after the previous sharp rally is the real reason behind the market’s panic and excess move.

Source: Original Article

Stocks OutLook

Amazon.com, Inc.
$248.00
Apple Inc.
$347.73
Dow Inc.
$32.61
Brent Crude USD
$0.00043
S&P 500
$7,623.68
FTSE 100
$10,690.36

Forex

AUDUSD=X
AUD/USD
CCY
$0.704
$0.00193
0.27%
GBPUSD=X
GBP/USD
CCY
$1.34
$0.0021
0.16%
NZDUSD=X
NZD/USD
CCY
$0.57
$0.00194
0.34%
EURUSD=X
EUR/USD
CCY
$1.12
$0.00176
0.16%
GBPJPY=X
GBP/JPY
CCY
$209.78
$0.101
0.05%
EURJPY=X
EUR/JPY
CCY
$175.40
$0.436
0.25%

Related News

US Interest Rate Forecast: Oil Rally Fuels December Fed Hike Risks

Silver Price Analysis as October Sell-Off Tests the Market’s Recovery Prospects

USD/JPY Forecast: Is Rising Japanese Inflation Supporting the Yen?

EUR/USD Weekly Outlook – ActionForex

Trending News

EUR/USD Price Prediction: Analyst Warns of More Downside Before a Rebound

by MarketNewsBoard
October 24, 2026

Home » Journal » EUR/USD Price Prediction: Analyst Warns of More Downside Before a

Read moreDetails

Silver forecast: metals liquidation drags XAG/USD into $50-55 support

by MarketNewsBoard
October 24, 2026

Silver forecast as XAG/USD slides into long-term support between $50 and $55, with metals liquidation, falling

Read moreDetails

Daily Oil, Gold, Silver Technical Analysis

by MarketNewsBoard
October 23, 2026

Gold: Tests $4,000 Support Zone as Bears Maintain PressureGold extended its downward trajectory below the green

Read moreDetails
Microsoft CorporationMSFT
0.66%
$524.51
FTSE 100^FTSE
0.32%
$10,690.36
S&P EUROPE 350^SPEUP
0,28%
2.588,51 €
S&P 600^SP600
0.29%
$1,681.71
Russell 2000^RUT
0.29%
$2,775.90
NYSE Arca Gold BUGS Index^HUI
2.20%
$675.84

Top Stories

BTCUSD: Bitcoin Steadies Below $82,000 as ETF Flows Reverse Sharply. When Bottom?

by TradingView
2026-10-23

Bitcoin recovers modestly after following technology stocks lower. A sharp reversal in ETF demand and Friday’s options expiry put the…

USD/JPY: Yen Hits 5-Week High at ¥156.10 as US Yields Slide, Japan Inflation Hits 2026 Peak

by TradingView
2026-10-23

Demand for safety and falling US Treasury yields lift the Japanese currency. Firmer inflation also strengthens the case for another…

IXIC: Nasdaq Sinks 2.6% as AI Fears Ripple Across Markets. Gains Are Focused Elsewhere

by TradingView
2026-10-23

Technology stocks retreat as investors question the cost of AI expansion. Bonds attract buyers, oil approaches $114 and global markets…

TSLA: Tesla Stock Falls 3% as Spending Cuts, Shrinking Profits Cloud Earnings Beat

by TradingView
2026-10-22

Positive cash flow and stronger automotive margins offered encouragement, but lower investment plans and a distant Optimus timetable kept investors…

META: Meta Stock Rises 4% on Big Revenue Beat. New Share Class Will Help Fund AI

by TradingView
2026-10-22

Strong advertising growth supported the outlook, while Meta created non-voting shares to expand its financing options. Cash flow is below…

Advertisement

Market Overview

Featured News

Forex Market

EUR/USD Weekly Forecast: Fed, ECB and 1.1000 in focus

by MarketNewsBoard
October 23, 2026

The single currency alternated gains and losses against the US Dollar (USD) this week, prompting EUR/USD to stabilise around the...

Read moreDetails

EUR/USD failed to break through the French barrier

October 23, 2026

Silver Forecast: XAG/USD Hits Fresh 2026 Lows as Selling Pressure Accelerates

October 23, 2026

Gold Technical Outlook: XAU/USD Breakdown Threatens Deeper Selloff

October 22, 2026

EUR/USD Bounce Hits a Wall of Fed Hawks and French Finances

October 22, 2026

Euro: Range trading consolidation persists against US Dollar

October 22, 2026

EUR/USD rebounds from 1 (100%) support Arc. Potential advance toward 1.1258

October 21, 2026

The dollar was so overbought

October 21, 2026

Semiconductor Silver Conductive Paste Market : Leading

October 21, 2026

Forex Overview

EUR/USD
$1.12
$1.12
0.16%
GBP/USD
$1.34
$1.34
0.16%
AUD/USD
$0.704
$0.704
0.27%
NZD/USD
$0.57
$0.57
0.34%
EUR/JPY
$175.40
$175.40
0.25%
CAD/JPY
$111.98
$111.98
0.08%
NZD/CAD
$0.798
$0.798
0.37%
EUR/NZD
$1.97
$1.97
0.47%
GBP/CHF
$1.10
$1.10
0.39%
SymbolPrice52 Week RangeChart (5D)
EURUSD=X$1.12
GBPUSD=X$1.34
AUDUSD=X$0.704
NZDUSD=X$0.57
AUDJPY=X$110.36
GBPJPY=X$209.78
NZDCAD=X$0.798

Market News

Commodities

Antibacterial Silver Spray Market Research Reveals Strong 13%

Antibacterial Silver SprayThe antibacterial silver spray market is witnessing impressive growth, driven by increasing applications across healthcare, personal care, and...

by MarketNewsBoard
October 21, 2026
Commodities

Silver whipsaws on conflicting US-Iran deal reports as markets hope for breakthrough ahead of midterms

Silver whipsaws on conflicting US-Iran deal reports as markets hope for breakthrough ahead of midterms !"#$%&'()*+,-./0123456789:;<=>?@ABCDEFGHIJKLMNOPQRSTUVWXYZ^_`abcdefghijklmnopqrstuvwxyz{|} !"#$%&'()*+,-./0123456789:;<=>?@ABCDEFGHIJKLMNOPQRSTUVWXYZ^_`abcdefghijklmnopqrstuvwxyz{|} Source: Original Article

by MarketNewsBoard
October 21, 2026
Commodities

Silver Price Today | Price of Silver Per Ounce | 24 Hour Spot Chart

Silver Price Today — Per Ounce, Gram and KiloThe table below breaks today's silver spot price in U.S. dollars into...

by MarketNewsBoard
October 21, 2026

[MARKET ANALYSIS] Crude firmer after brief spike; gold and silver softer

by MarketNewsBoard
October 21, 2026

Crude futures are firmer after a brief spike saw WTI reach a high of USD 99.09/bbl and Brent USD 110.16/bbl...

What are nonfarm payrolls and how do they affect markets?

by MarketNewsBoard
October 12, 2026

Nonfarm payrolls (NFP) are a headline measure of monthly employment change in the United States. The release can move interest-rate...

Nonfarm Payrolls (NFP)

by MarketNewsBoard
October 5, 2026

Nonfarm payrolls (NFP) is a monthly US report on jobs added or lost, closely watched by investors across traditional and...

Crypto Market

Litecoin Price Risks Drop to $35 if $43 Support Breaks

Charles Hoskinson Says Crypto Needs 3-6 More Months, Names Ripple as a Key Player

Ripple Launches Platform for Institutional RLUSD Operations

Ripple Doubles Down on RLUSD With Mint Launch and Notabene Investment

RLUSD gets Ripple Mint and Notabene boost as volume drops

Directive on lending to undocumented immigrants could ripple across ABS markets

Ripple Launches RLUSD Minting Platform, Expands Push Into Institutional Payments

Ripple’s RLUSD gets two boosts as transfer volume drops 25%

Ripple Just Solved RLUSD's Two Biggest Problems With Ripple Mint and Notabene Deal

Crypto News

Litecoin Price Prediction: Is LTC Heading Toward $40 After Trendline Breakdown?

by MarketNewsBoard
July 25, 2026

Litecoin (LTC) has broken below its ascending support trendline, confirming a shift in short-term market structure. The breakdown was followed...

Ripple Launches Ripple Mint for Institutional RLUSD Access

by MarketNewsBoard
July 25, 2026

Ripple has rolled out Ripple Mint, a new institutional platform designed to make it easier for regulated organizations to interact...

Litecoin Approaches Descending Channel Breakout as Technical Momentum Builds

by MarketNewsBoard
July 24, 2026

Litecoin approaches a long-term channel breakout while holding above $47, keeping resistance under close technical observation.Long liquidations have eased after...

Ripple Launches Institutional Mint Platform for RLUSD Amid Transfer Volume Drop

by MarketNewsBoard
July 24, 2026

Ripple is opening a new front in the institutional stablecoin race just as usage data for its RLUSD token softens....

Editor's Pick

UN Food Security Report Finds $540BN in Farm Subsidies Locked Into Commodities That Crowd Out Plant Foods – vegconomist

by MarketNewsBoard
July 22, 2026

The 2026 edition of The State of Food Security and Nutrition in the World, published jointly by FAO, IFAD, UNICEF,...

Read moreDetails

AEGIS Hedging to Be Acquired by Private Equity at Goldman Sachs Alternatives

by MarketNewsBoard
July 22, 2026

Investment alongside the existing AEGIS management team will advance capabilities to enable better decision-making across global commodity markets THE WOODLANDS,...

Read moreDetails

Glencore plans large LME lead withdrawals after stocks surge, sources say

by MarketNewsBoard
July 22, 2026

More than 46,000 tons of lead warrants cancelled over past weekTrafigura delivered huge amount of lead to Singapore this monthLONDON,...

Read moreDetails
Market Overview

AI Turns Competence into a Commodity: Evidence from 2.26 Million Freelance Contracts

July 22, 2026
Market Overview

JPMAM adds commodities to lagging multi-asset strats

July 22, 2026
Market Overview

New Houthi maritime strikes keep European gas futures pinned near multi-month peak

July 22, 2026
Market Overview

DERIVSOURCE: CFTC Drops Reporting Requirements for Physical Commodity Swaps

July 22, 2026

Commodity Market

Silver Price Analysis as October Sell-Off Tests the Market’s Recovery Prospects

October 24, 2026

Silver forecast: metals liquidation drags XAG/USD into $50-55 support

Daily Oil, Gold, Silver Technical Analysis

Silver Forecast: XAG/USD Hits Fresh 2026 Lows as Selling Pressure Accelerates

Semiconductor Silver Conductive Paste Market : Leading

October 21, 2026

Antibacterial Silver Spray Market Research Reveals Strong 13%

Silver whipsaws on conflicting US-Iran deal reports as markets hope for breakthrough ahead of midterms

Silver Price Today | Price of Silver Per Ounce | 24 Hour Spot Chart

[MARKET ANALYSIS] Crude firmer after brief spike; gold and silver softer

October 21, 2026

Silver Outlook: VC PMI and Cycle Date Analysis Point to Next Bullish Opportunity

Silver analysis today

Gold and Silver Market Correction 2026: Is the Bull Market Over?

MarketNewsBoard

MarketNewsBoard delivers trusted financial news, real-time market analysis, interactive charts, and economic insights across the global financial markets.

Covering Forex, Commodities, Stocks, Indices, Cryptocurrencies, and major economic events...

Market Overview

  • Forex Market
  • Commodities
  • Cryptocurrency News
  • Stocks
  • Indices
  • Crude Oil Prices
  • Economic Calendar

Resources

  • Central Banks News
  • Economy News
  • Interest Rate
  • Nonfarm Payroll
  • Charts

Tools

  • Currency Heat Map
  • Correlation Matrix
  • Market Sentiment
  • Currency Cross Rates
  • Crypto Rates
  • About Us
  • Contact Us
  • Disclaimer
  • Privacy Policy
  • Terms and Conditions

© 2026 MarketNewsBoard | Market Analysis, Charts & News.

AAPL
$347.73
AMZN
$248.00
BTC-USD
$80,658.24
EURUSD=X
$1.12
DX-Y.NYB
$101.75
NVDA
$210.96
TSLA
$372.22
DOW
$32.61
^N225
$62,693.16
JPY=X
$156.81
GBPUSD=X
$1.34
CAD=X
$1.40
NG=F
$3.05
BZ=F
$111.70
NFLX
$65.85
GOOG
$317.28
MSFT
$524.51
^RUT
$2,775.90
^FTSE
$10,690.36
AUDUSD=X
$0.704
CHF=X
$0.824
HG=F
$6.51
ETH=F
$2,356.00
No Result
View All Result
  • Home
  • Market Overview
    • Crude Oil Prices
    • Economy News
    • Cryptocurrency News
    • ETFs
    • Foreign Exchange News
    • Indices
    • Stock Market
    • Commodities News
  • Forex Market
    • Central Banks News
    • Currencies
    • Interest Rate
    • Nonfarm Payroll
  • Forex Analysis
    • EUR/USD
    • GBP/USD
    • NZD/USD
    • AUDUSD
    • USD/JPY
    • USD/CHF
    • USDCAD
  • Crypto
    • Bitcoin
    • Ethereum
    • BNB
    • Litecoin
    • Solana
    • XRP
  • Commodities
    • XAUUSD
    • XAGUSD
    • Oil & Gas
  • Charts
  • Economic Calendar

© 2026 MarketNewsBoard | Market Analysis, Charts & News.