


In 2021, the S&P 500 was up 28.7%.
In 2022, it was down 18.1%
In 2023 and 2024, the market went up 26.3% and 25%, respectively.
This year the S&P 500 is down 6% or so.
That’s a lot of ups and downs in a short period of time. The annualized return in this four years and change was *drumroll* a little more than 10% per year.
All of that movement and we landed right at the very long-run average.
This got me thinking — how often does the stock market give you 10% annual returns over various time frames?
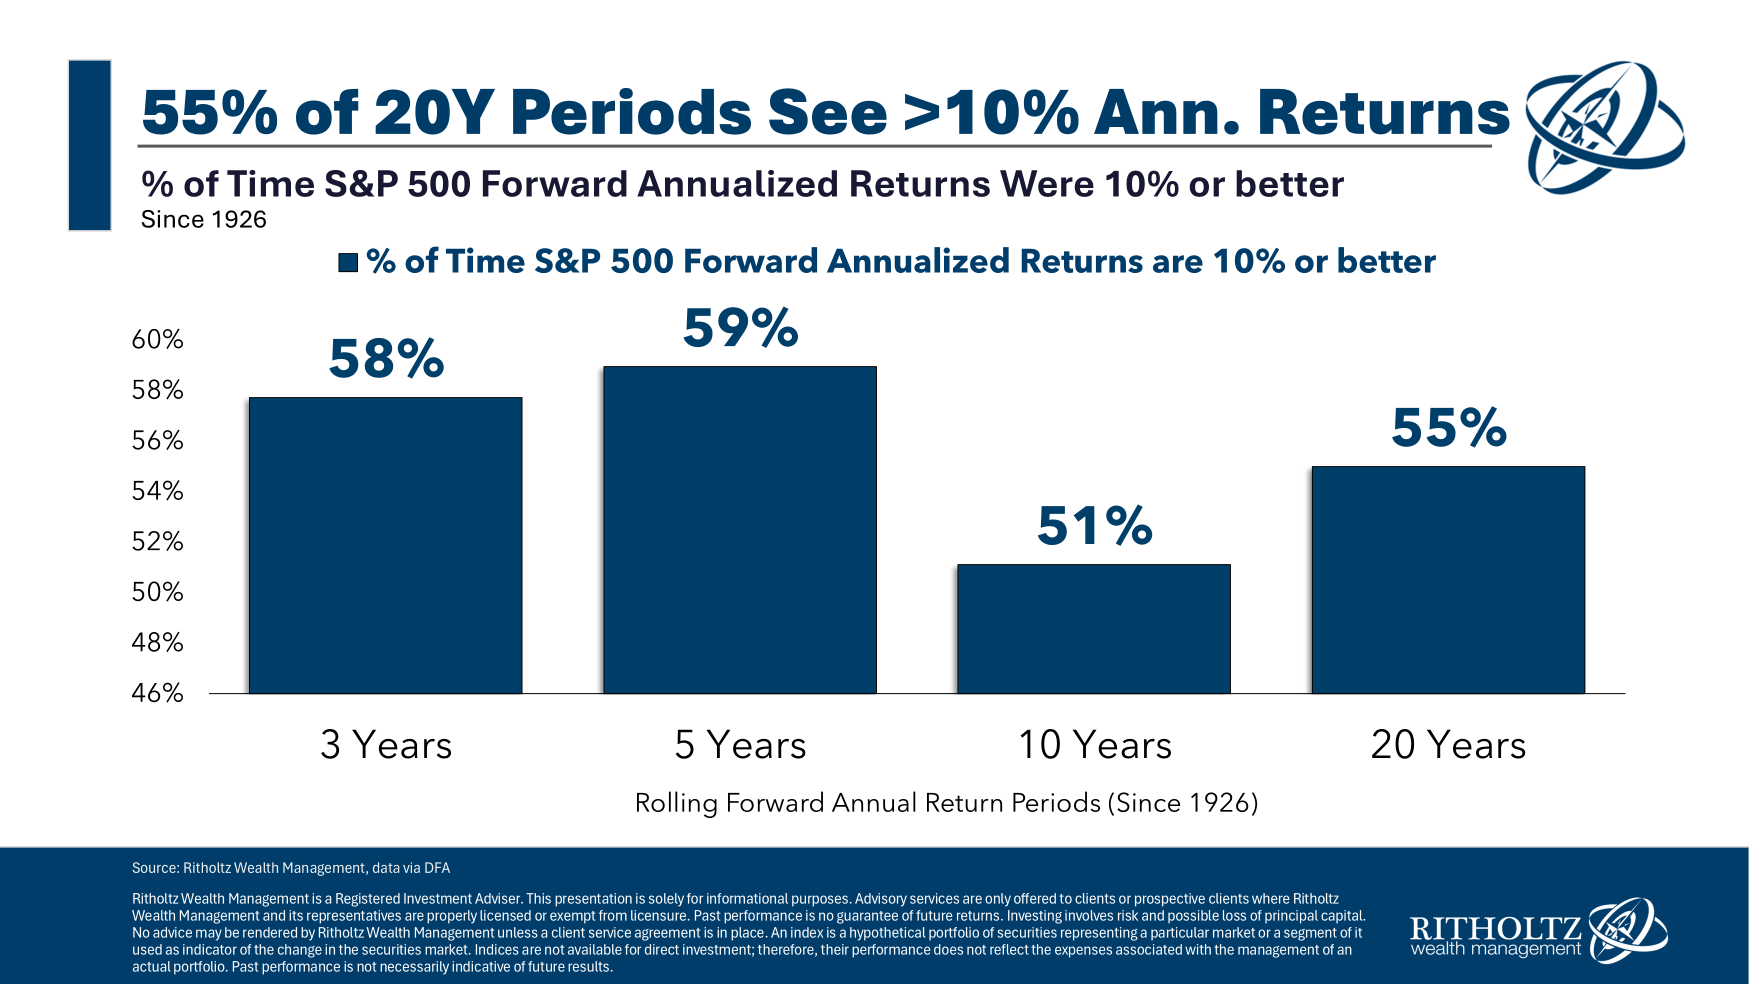
Here’s what I did — looked at S&P 500 return data going back to 1926, calculated the 3, 5, 10 and 20 year returns from the start of each year and then figured out how many of those annual return streams were 10% or better.
These are the results:
I suppose it makes sense that average returns occur around half the time. That’s how averages work although outliers can potentially skew the data.1
For instance, 15% of all 3 year returns were negative. Over 5 and 10 years, returns were negative 13% and 4% of the time, respectively. There were no 20 year periods with negative returns.
Alternatively, 35% of all 3 year periods experienced returns of 15% per year or higher. Over 5, 10 and 20 years it was 32%, 24% and 10% of the time, respectively.
So there’s a decently wide range around the averages, even over longer time frames.
It is worth noting that there were a number of returns that were relatively close to the long-term averages. So I looked at the percentage of time the stock market returned more than 7%, 8% and 9% as well:
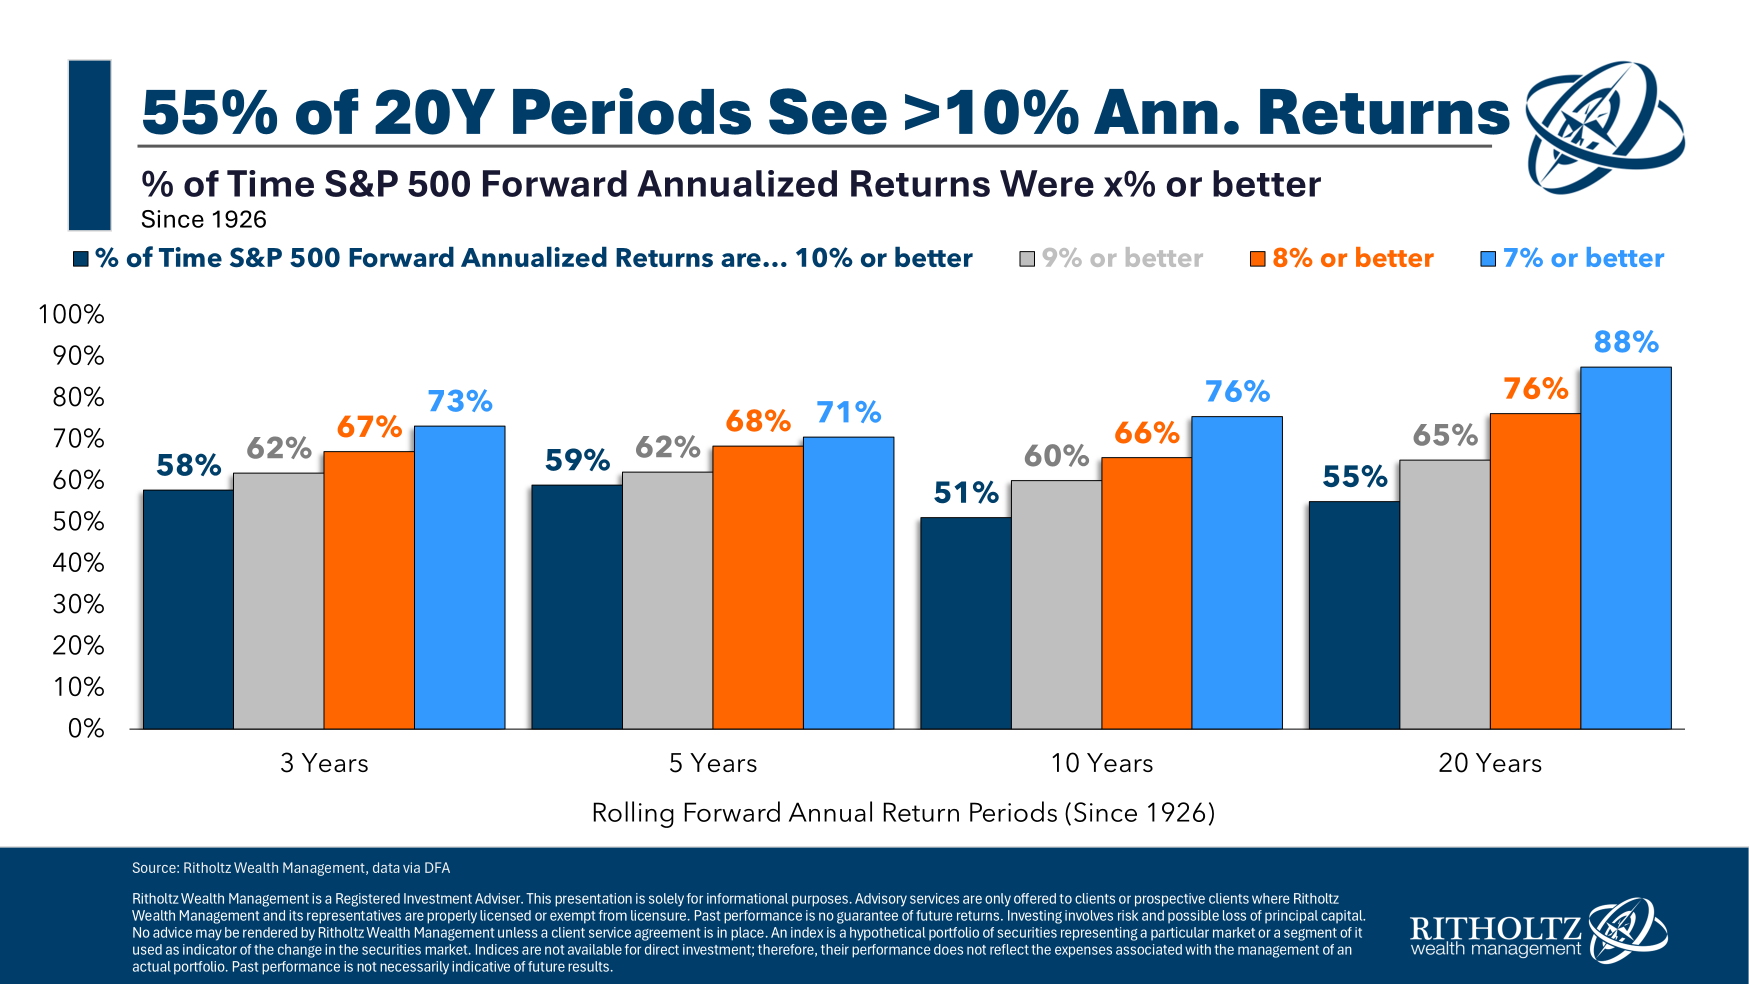
Those win rates are obviously higher but you can see high returns are promised to no one.
The odds have been in your favor historically but 24% of the time the U.S. stock market returned less than 7% per year over 10 years.
This is one of the nerve-wracking and frustrating aspects of investing in risk assets. Most of the time things are going to work out for you as a long-term investor. But some of the time you probably aren’t going to be thrilled with the results.
So goes the nature of risk in the markets.
This is one of the reasons I’m such a big proponent of dollar cost averaging. It’s a way to diversify your entry points to increase your odds of success.
Further Reading:
31 Years of Stock Market Returns
1This is a little nerdy but it’s also worth pointing out that these are geometric averages that take into account compounding and not a simple arithmetic average.
This content, which contains security-related opinions and/or information, is provided for informational purposes only and should not be relied upon in any manner as professional advice, or an endorsement of any practices, products or services. There can be no guarantees or assurances that the views expressed here will be applicable for any particular facts or circumstances, and should not be relied upon in any manner. You should consult your own advisers as to legal, business, tax, and other related matters concerning any investment.
The commentary in this “post” (including any related blog, podcasts, videos, and social media) reflects the personal opinions, viewpoints, and analyses of the Ritholtz Wealth Management employees providing such comments, and should not be regarded the views of Ritholtz Wealth Management LLC. or its respective affiliates or as a description of advisory services provided by Ritholtz Wealth Management or performance returns of any Ritholtz Wealth Management Investments client.
References to any securities or digital assets, or performance data, are for illustrative purposes only and do not constitute an investment recommendation or offer to provide investment advisory services. Charts and graphs provided within are for informational purposes solely and should not be relied upon when making any investment decision. Past performance is not indicative of future results. The content speaks only as of the date indicated. Any projections, estimates, forecasts, targets, prospects, and/or opinions expressed in these materials are subject to change without notice and may differ or be contrary to opinions expressed by others.
The Compound Media, Inc., an affiliate of Ritholtz Wealth Management, receives payment from various entities for advertisements in affiliated podcasts, blogs and emails. Inclusion of such advertisements does not constitute or imply endorsement, sponsorship or recommendation thereof, or any affiliation therewith, by the Content Creator or by Ritholtz Wealth Management or any of its employees. Investments in securities involve the risk of loss. For additional advertisement disclaimers see here:
Please see disclosures here.


